Need a quotation?

Dear Customers, if you wish to receive a quotation, we kindly ask you to fill in below form. Once the form has been duly filled and submitted, the rates will be quoted to you.

SEARCH SITE BY TYPING (ESC TO CLOSE)

Skip to Content

About: lambui

Recent Posts by lambui

Hapag-Lloyd applies new GRI from Asia

Hapag-Lloyd announced a General Rate Increase (GRI) from Asia, excluding Japan, to the West Coast of Latin America, Mexico, the Caribbean and Central America.

The new GRI will apply to cargo transported in 20’ and 40’ dry containers, including high cube equipment and 40’ non-operative reefers and will be effective from 16 October until further notice.

The German ocean carrier said it will increase its rates by US$250 per 20′ dry container and US$500 per 40′ dry container/40′ high cube container/40’ non-operative reefer.

Regarding the geographical scope of this rate increase, Asia includes China, Macau, South Korea, Thailand, Singapore, Vietnam, Cambodia, Philippines, Indonesia, Myanmar, Malaysia, Laos and Brunei and the West Coast of Latin America, Mexico, the Caribbean and Central America covers the following countries: Mexico, Ecuador, Colombia, Peru, Chile, El Salvador, Nicaragua, Costa Rica, Dominican Republic, Puerto Rico, Jamaica, Honduras, Guatemala and Panama.

Source: Container News
READ MORE

The history of container shipping

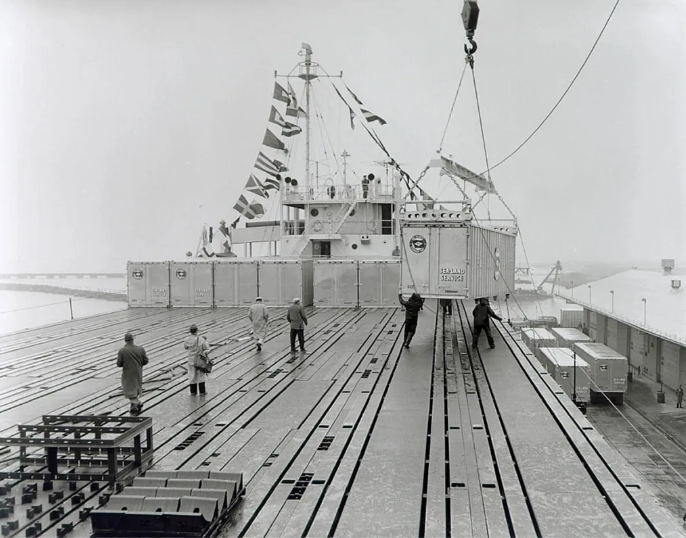
Containers being loaded on the “first container ship”, Ideal-X, in 1956 / Source: Maersk/SeaLand

Container transportation is now the most popular way of cargo movement and a critical pillar of the global economy, but back in the 1950s, it was just a thought.

We will travel back to the creation of the “first container”, the need for the “first container ship” and the historical development of the container shipping industry.

1766:

Everything started in 1766, when James Brindley, one of the most remarkable engineers of the 18th century, designed the Starvationer, a boat to transport coal between coal mining sites in England. The boat could carry 10 wooden containers to transport coal through England’s Bridgewater Canal.

1795:

Almost 30 years later, in 1795, Englishman Benjamin Outram, a civil engineer, surveyor and pioneer in canal and tramway construction, came up with an invention, which many consider “the first container”. The aim of Outram’s container was the transportation of coal, too.

Horses were pulling the containers from the coal mines, along the railways, up to the canals, where they were carried on barges. Once reaching the destination, they were once again unloaded from the barges, and horses were used to carry them to their final destination. We can call it the “first intermodal service” in history.

This is how container traffic began.

1830s:

In the 1830s, coal was transported by trains. A railroad car had the capacity of four simple wooden containers, which were then loaded into horse-drawn wagons. Each wagon was able to carry one container.

1840s:

In the 1840s, iron boxes made their appearance and began to be used, in addition to wooden ones.

20th century:

Closed models for highway and rail transportation began to appear in the early 20th century. It was around this time, before World War II, that different primitive container prototypes began to appear in various European countries.

1927:

In 1927, we see the packing of the luggage of passengers on a luxury train between London, UK and Paris, France into four containers.

1934:

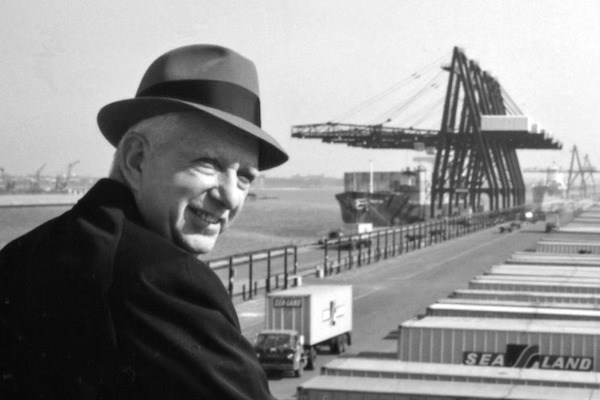
Born in North Carolina, Malcolm McLean (1913-2001) graduated from high school in 1931, after which he worked for a few years to raise money to buy a used truck. In 1934 McLean founded his own trucking company, which soon would operate five trucks.

Malcolm-McLean / Source: Maersk

1937:

In 1937, Malcolm McLean saw dockworkers packing and unloading goods for several hours and thought that this was a waste of time and money.

1950:

By 1950, Malcolm McLean’s company had grown to include 1,750 trucks, being the fifth largest firm in America in its field.

Given that the application of weight restrictions and taxes to freight transportation began around 1950, and fining was not at all unusual for his company’s drivers, McLean thought of developing a standard-size container trailer that could be loaded onto ships by the hundreds.

This would mean decommissioning most of the trucks and using ships to transport the goods to different truck terminals at city ports, thus receiving fewer fines.

1955:

McLean’s next step was to sell his trucking business in 1955 and take out a loan that he would partially use to buy a shipping company, named Pan-Atlantic Steamship Company, which already had docking rights in several eastern port cities in the United States.

McLean began testing different container variations, coming up with the primitive model known as the container even today. However, unlike modern 20′ and 40′ containers, this one was around 11 metres long. It was a standard, durable, stackable, easily loadable and lockable solution.

Coming with no surprise, these containers required a suitable ship, which would be able to carry these boxes.

For this reason, McLean bought some of the T2 tankers from World War II to modify them in such a way that they could carry 58 containers and 15,000 tons of oil.

Meanwhile, in the same year, the first container dedicated vessel, Clifford J.Rodgers, was put into service and was used to deliver non-standard cargo containers from railheads in Vancouver and Skagway.

Clifford J.Rodgers was 102.24 meters long, 14.33 meters wide and was able to carry specifically designed containers of 2.14 meters long, with a capacity perhaps equivalent to 65-70 TEUs. The ship was able to sail at a speed of 11.75 knots and was operated by 15 crew members.

1956:

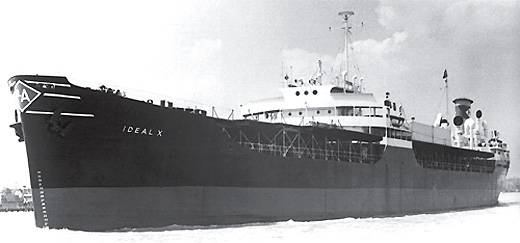
The most notable moment in the history of container shipping was in 1956, when Pan-Atlantic Steamship Company used one of the tankers, Ideal X, to move containers on an intra-US route. On 26 April 1956, Ideal X departed New Jersey port to sail for Houston, carrying cargo-laden truck-trailers.

Soon, the company began to receive orders as McLean could offer freight transportation solutions at a price that was 25% lower than the corresponding cost of traditional transportation ways.

Ideal X, the first “container ship”

After Ideal X’s successful maiden voyage, McLean ordered Gateway City, the world’s first ship designed from scratch for container transportation.

1957:

Gateway City has a capacity of 226 containers and made its maiden voyage in October 1957, sailing from the port of New Jersey to the port of Miami. The cargo was packed and unloaded by only two longshoremen at a speed of 30 tons per hour.

1960:

In 1960, Pan-Atlantic Steamship Company was renamed Sealand Industries.

1964:

Ideal X was scrapped in Japan in 1964 after it suffered extensive damage in heavy weather.

1966:

By 1966, containers have started to be moved out of the United States to the Netherlands, Scotland, Vietnam and East Asia.

1999:

More than 30 years later, in 1999, SeaLand was acquired by the Danish transportation giant Maersk, one of the largest container shipping companies in the world until now.

Source: Container News

READ MORE

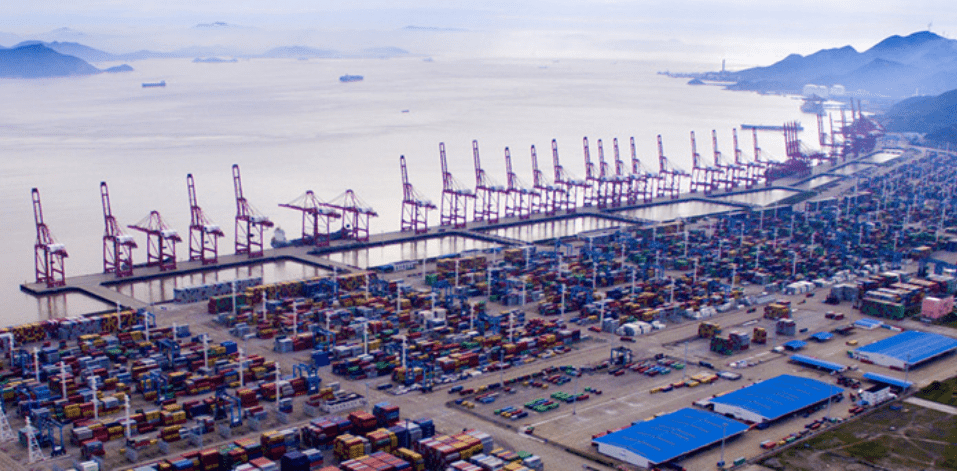
Chinese ports exceed 200 million TEUs in 2023 so far, Shanghai and Ningbo remain on top

Container volume at China ports rose by 4.8% in the January-August period, compared to the same months last year.

The container throughput of Chinese ports was 203.7 million TEUs, while for the same period, the cargo volume of major Chinese ports was 11.1 billion tons, translating to an 8.4% rise year-on-year.

The following table mentions cargo and container throughput data from China’s twelve major ports.

As seen in the table, the port of Shanghai has maintained its dominance, being the busiest container port in the country with 32 million TEUs.

The port of Ningbo & Zhoushan is the second busiest box port in China with 24 million TEUs and in the third place, we find the port of Shenzhen with 19 million TEUs.

At the same time, the port of Shenzhen was the only one from the list that reported a year-on-year decline in its container volumes from January to August with its throughout falling by 2.1%.

Meanwhile, the largest percentage growths were registered at the smaller ports of Yinkou, Beibu Gulf, Dalian and Lianyungang. Yinkou reported year-on-year box growth of 21.7%, Beibu Gulf achieved a 15% container increase, Dalian saw its TEU volumes rise by 14.3% and Lianyungang increased its throughput by 14.2%.

Source: Container News
READ MORE

Japan’s container volumes decrease for four consecutive months

Oceangoing containers to and from Japan’s six major ports totaled 1.13 million TEUs in July, which slid 8.7% from the corresponding month of the previous year and have registered a year-on-year decrease for four consecutive months.

Looking at volumes at individual ports, Tokyo incurred a double-digit contraction, processing 334,842 TEUs, down 17.4%, with exports plunging 18.5% to 152,807 TEUs, and imports 16.3% to 182,035 TEUs.

A double-digit decline was made at Kawasaki as well, as it handled 7,442 TEUs, down 17.7%. Exports plummeted by 21.6% to 3,450 TEUs, and imports fell by 14% to 3,992 TEUs.

A throughput shrinkage was much smaller at Yokohama, where 229,039 TEUs were moved, down 2.3%. Exports fell by 4.9% to 119,191 TEUs, but imports rose 0.7% to 109,848 TEUs.

Nagaya was the only one of the six Japanese ports to enjoy an improvement in container lifting, which picked up 0.6% to 211,562 TEUs. Although exports waned 0.1% to 108,380 TEUs and imports swelled 1.4% to 103,182 TEUs.

Containers to and from Osaka sank 10.9% to 166,982 TEUs, consisting of 75,395 TEUs of exports, down 11.8%, and 91,587 TEUs of imports, down 10.2%.

Moreover, Kobe was responsible for 177,743 TEUs, down 6%, which comprised 92,627 TEUs of exports, down 7.8%, and 85,116 TEUs of imports, down 4%.

Source: Container News
READ MORE

CN analysis: Demand pressure continues to stall rate recovery on trades out of India

With the exception of trades to Europe and the Mediterranean, container freight rates out of India have seen no noticeable recovery signs for carriers, according to the latest market analysis by Container News.

On the westbound India-Europe trade, average short-term contract rates from West India [Jawaharlal Nehru Port (JNPT)/Nhava Sheva or Mundra Port] to Felixstowe/London Gateway (UK) or Rotterdam (the Netherlands) have risen to US$650 per 20-foot container and US$700 per 40-foot container, from US$550 per 20-foot container and US$650 per 40-foot container at the end of August.

For West India-Genoa (the West Mediterranean) bookings, September contract rates have stood at US$800/TEU, from US$675, and US$750/FEU, from US$650, according to the CN analysis.

However, eastbound cargo (imports into India) rates for these port pairings have continued to fall, month-on-month. According to the analysis, average rates have cooled to US$600/TEU, from US$650, and US$650/FEU, from US$750, for bookings from Felixstowe/Rotterdam to West India, whereas rates for shipments from the West Mediterranean (Genoa) to Nhava Sheva/Mundra have remained steady, at US$350/TEU and US$500/FEU.

Short-term contract prices on the India-US trades have been steady to slightly decreasing, from August levels, despite attempting another round of general rate increases (GRI) by major carriers. Average rates in August for shipments from West India (Nhava Sheva/Mundra) to the US East Coast (New York) have moderated to US$1,700/TEU, from US$1,870, but FEU rates have gained moderately – rising to US$2,100/FEU, from
US$2,050/FEU last month. For Indian container loads moving to the US
West Coast (Los Angeles), rates have seen no major changes from end-July levels, hovering at US$1,600/TEU and US$1,700/FEU.

Also, for the West India-US Gulf Coast (Houston) trades, there have been no changes in rate levels, month on month, hovering at US$1,875/TEU and US$2,575/FEU, the CN analysis shows.

That rate trendline on the India-US trade is an indication that carriers have made no recovery from the September 1 rate increase attempts.

Short-term contract rates on the US-India trades (return leg) have continued to remain at the averages seen in August, at US$475/TEU and US$550/FEU from the US East Coast to West India, and at US$1,000/TEU and US$1,150/FEU for US West Coast-West India bookings.

August average rates from the US Gulf Coast to West India have stood at US$800/TEU and US$1,100/FEU, indicating again no changes from end-August trends.

Rates on intra-Asia trades out of India have seen a further slide in September, with the exception of a steady rate trend for North/South China bookings, the CN analysis reveals. For West India-Yantian (South China), the analysis has put average rates at US$115/TEU and US$230/FEU, while for West India-Central China (Shanghai), rates have hit rock bottom levels at US$5 for both TEU and FEU loads, versus US$10/TEU and US$15/FEU, respectively, month-on-month.

For West India-North China (Tianjin) trades, September rates have held firm at US$65/TEU and US$125/FEU.

Similarly, for Indian cargo to Singapore, rates have plunged US$5 for both TEU and FEU bookings, down 50% from US$10 last month, according to the CN analysis.

For Indian shipments to Hong Kong, carriers have kept rates down to US$10 per TEU/FEU, versus us$10/TEU and US$15/FEU in August.

Average September prices for a TEU booking West India-Jebel Ali/Dubai shipments have dropped to US$50/TEU and US$90/FEU, from US$60 and US$130, respectively, a month ago.

With the Indian export trade struggling to pace up, there is little chance that carriers will be able to rally a rate recovery seen in the coming weeks.

According to new data released by the Indian Ministry of Commerce & Industry, Indian merchandise export trade, by value, saw a 7% decline in August, albeit the slowest year-over-year fall in recent months.

“Sluggish global economic contraction and demand especially in major economies like the EU, the UK and China, coupled with the subdued growth in economies like the US and Australia, has led to such a modest performance in exports during the recent months,” A Sakthivel, president of the Federation of Indian Export Organisations (FIEO), said in a statement.

Sakthivel added, “Manufacturing across the Euro Zone and the US has also contracted due to persistent policy tightening measures by both the US Fed and the European Central Bank, squeezing finance.”

He also pointed out, “The softening of the commodity prices across the globe has also pulled down value-wise exports.”

Sakthivel went on to explain, “The moderation in pace of growth in merchandise exports significantly in 2023 has been mainly because of ongoing geopolitical tensions, disruption in global supply chain due to Russia-Ukraine war, monetary tightening and recessionary fears, which have continuously led to a fall in consumer spendings across the globe especially in advanced economies.”

However, the FIEO chief expressed optimism that the pace of Indian exports will rebound in the coming months with fresh orders kicking in for the holiday season.

Source: Container News

READ MORE

Port of Oakland sees lower box volumes

Container volume at the Port of Oakland fell in August compared to the same month last year with the Californian port handling 135,253 TEUs, down 13.1% year-on-year.

“However, the robust volume in August 2022 draws an unrealistic comparison to this August’s numbers,” noted the US port.

Vessel calls have continued to grow throughout 2023, reporting 650 vessel calls through the end of August, rising 13% over the number of vessel calls in August 2022.

Port of Oakland’s official said, “This indicates that port operations are running smoothly, boasting better on-time performance of ships, and less congestion at docks and at inland warehouses.”

“While August’s container volumes might not be where we want them to be, there are indicators that point to a bright future for the seaport,” said Port of Oakland Maritime Director Bryan Brandes, adding, “Improved port operations, coupled with our on-going investment in greening the port, will provide on-going benefits to importers and exporters.”

In more detail, full imports in August dropped by 17.5% with 72,481 TEUs, while full exports shrunk by 7.5% with 62,733 TEUs. Empty imports were down by 11.1%, moving 13,329 TEUs in August 2023, while empty exports declined 29.6%, registering 30,579 TEUs.

Exports have slumped, pointing to the continued decline in the export of wastepaper and recyclable materials for processing. However, there is optimism that agricultural exports will pick up.

According to the announcement, vessels are running on schedule and unloading and loading cargo with little disruption, which are favorable conditions, especially for exporters.

Source: Container News

READ MORE

Singapore is top maritime centre for 10th consecutive year

Singapore is ranked the top maritime centre in the Xinhua-Baltic International Shipping Centre Development Index (ISCDI) Report for the tenth consecutive year.

The report, published jointly by the Chinese state news agency Xinhua and global marine data supplier Baltic Exchange, names Singapore as the world’s leading maritime centre, followed by London and Shanghai.

Singapore received 95.32 points out of a possible 100, while the marine support services powerhouse of London received 83.35 points and the port city of Shanghai received 81.58 points.

Singapore has topped the Index since it started a decade ago. Its position has been maintained as a result of its winning mix of strategic location, worldwide vision, and developed ecosystem of competent global marine services and strong governance.

For the previous four years, London and Shanghai have held the second and third positions in the Index.

There was minimal change in the top 10, with Hong Kong, Dubai, Rotterdam, and Hamburg taking fourth, fifth, sixth, and seventh position, respectively.

Furthermore, the trading capital of New York and its New Jersey port fell two places from eighth to tenth this year, while Athens/Piraeus rose by one place. Ningbo-Zhoushan, a newcomer to the Index, is ranked ninth. The Chinese city’s placement in the top ten is mostly due to its status as the world’s busiest port in terms of cargo tonnage.

This report rated 43 maritime locations, taking into account port factors such as cargo throughput, crane count, container berth length, and port draught.

According to a statement, the number of players in professional maritime support businesses such as shipbroking, ship management, ship financing, insurance, and law, as well as hull underwriting premiums and general business environment factors such as customs tariffs, the extent of electronic government services, and logistics performance.

Source: Container News

READ MORE

Ports of Singapore and Rotterdam join forces to cut shipping emissions

The Maritime and Port Authority of Singapore (MPA), the Port of Rotterdam Authority (PoR), and 20 partners in the Green & Digital Shipping Corridor are collaborating to cut international shipping emissions by 20%-30% until 2030.

The agreement was made in the third Green Corridor workshop, which was held in Rotterdam, the Netherlands this week.

The Green & Digital Shipping Corridor was formed in August 2022 to bring together supply chain partners to achieve zero and near-zero emissions shipping on the Rotterdam-Singapore route, with the ultimate goal of reaching net-zero emissions by 2050.

The corridor has received strong support from global value-chain partners such as shipping lines, port authorities and operators, fuel suppliers, fuel coalitions and organisations, banks, premier universities of higher learning, and knowledge partners during the last year.

Moreover, the corridor will continue to intensify efforts to meet the International Maritime Organization’s (IMO) increased goal under the 2023 IMO Strategy on reducing GHG Emissions from Ships.

This will be accomplished by the development and use of zero and near-zero emission fuels in large container vessels (at least 8,000 TEUs) deployed along the 15,000 km route, as well as through a mix of operational and digital efficiency.

According to a statement, a modelling study led by the Mærsk Mc-Kinney Møller Center for Zero-Carbon Shipping, one of the project’s corridor partners, and supported by the ports investigated multiple alternative fuels across a range of zero and near-zero emission pathways, such as synthetic and bio-variants of methanol, ammonia, and LNG.

Aside from the study, hydrogen is another possible fuel pathway that should be investigated. Efforts are being made to aggregate demand and supply in order to close the cost gap in the adoption of sustainable fuels.

Working groups have been formed to investigate the deployment of all of these fuels in the trade lane, covering topics such as fuel demand and supply, standards, safety procedures, financing, and legislation. This week, the corridor partners met in Rotterdam to determine the next measures for various fuel pathways.

Source: Container News

READ MORE

Change in US consumer behaviour hampers Transpacific trade

As the traditional peak season of the shipping sector comes to an end, the spot rate declines over the past two weeks are a very clear indicator that the peak season did not really materialise, according to the recent Sea-Intelligence report.

Further to that, the Danish maritime data analysis company noted that there are “dark clouds looming over the horizon” for the Transpacific trade, in part linked to US consumer behaviour.

One element is the change in consumer behaviour during the pandemic (from services to goods), which is very likely to change back and have a negative impact on import volumes, according to the report.

“Digging deeper, we see that in recent months, the growth is concentrated on goods which are not predominantly moving in containers,” said Alan Murphy, CEO of Sea-Intelligence.

As shown in the figure, the highest growth is for recreational goods and services, which rose from 12% in 2019 to 17.2% by July 2023. Moreover, the Danish analysts note that the largest growth within this category is exhibited by ‘Video, Audio, Photographic, Information Processing Equipment, and Media’.

The ‘Information Processing Equipment’ is also growing fast mid-2023 with the main driver of strong growth within this category clearly seen to be Computer Software and Accessories; and software is mainly not moving in containers, which means that this strong boost to consumer spending does not benefit container shipping lines.

“Another major growth component on goods spending is the overall ‘Vehicles’ category. New vehicles are indeed growing well, but once again, these are mainly not containerized,” said Murphy.

Source: Container News

READ MORE

Container lines consolidate service networks out of South India as trade expands

Container lines are rapidly expanding connections out of South India to keep pace with growing trade volumes.

But the concentration of calls at private box terminals operated by Adani Group, which act as alternatives to Chennai Port, is becoming increasingly evident.

HMM has cemented its network with direct sailings out of Adani Kattupalli Port (AKPPL). Its FIM [Far East Asia-India-Mediterranean] service is a major boon for southern India shippers traditionally tethered to transshipment over Sri Lanka’s Colombo Port for mainline connections.

The FIM rotation is Busan, Kwangyang, Shanghai, Ningbo, Shekou, Singapore, Port Klang, Kattupalli, Nhava Sheva, Mundra, Karachi, Jeddah, (Suez Canal), Damietta, Piraeus, Genoa, Valencia, Barcelona, Piraeus, Damietta, (Suez Canal), Jeddah, Karachi, Mundra, Nhava Sheva, Kattupalli, Singapore, Da Chan Bay and back to Busan.

In addition, CMA CGM has opened a new string out of Adani Ennore Container Terminal (AECTPL) for North Europe and the Mediterranean. The NEMO [North Europe-Mediterranean-Oceania] Service rotates Ennore, Colombo, Malta, Valencia, London Gateway, Rotterdam, Hamburg, Antwerp, Le Havre, Fos Sur Mer, La Spezia, Malta, Pointe Des Galets, Port Louis, Sydney, Melbourne, Adelaide, Singapore and Ennore.

“This new call will offer our customers a fast export connection from the main commercial area in South East India to Europe together with a direct import connection from Australia and Singapore,” said CMA CGM in a customer advisory, announcing the Ennore call.

The carrier further noted, “Ennore is also a natural gateway from/to ICD [inland container depot] Bangalore covered with an efficient rail connectivity and will provide a best-in-class service to the fast-growing automotive industry.”

The NEMO competes directly with Maersk’s ME7 Service, connecting South India trade via Ennore to North Europe.

The ME7 port rotation is Ennore, Colombo, Salalah, Algeciras, Felixstowe, Rotterdam, Bremerhaven, Jeddah, Salalah, Colombo and Ennore.

With more call additions, Kattupalli and Ennore have already made sizeable inroads into the Chennai market. According to available data, Kattupalli saw 58,046 TEUs last month, while Ennore handled 59,985 TEUs.

The growing shift of volumes to emerging port locations poses challenges for box terminals at Chennai Port, putting further investment in capacity development there at risk.

Source: Container News

READ MORE


Recent Comments by lambui

    No comments by lambui