Need a quotation?

Dear Customers, if you wish to receive a quotation, we kindly ask you to fill in below form. Once the form has been duly filled and submitted, the rates will be quoted to you.

SEARCH SITE BY TYPING (ESC TO CLOSE)

Skip to Content

Category Archives: Freight News

Asian ports eye Gemini Cooperation potential impact

Key Asian ports that have been ostensibly excluded from Gemini Cooperation are monitoring the potential impact once the Maersk-Hapag-Lloyd tie-up starts in 2025.

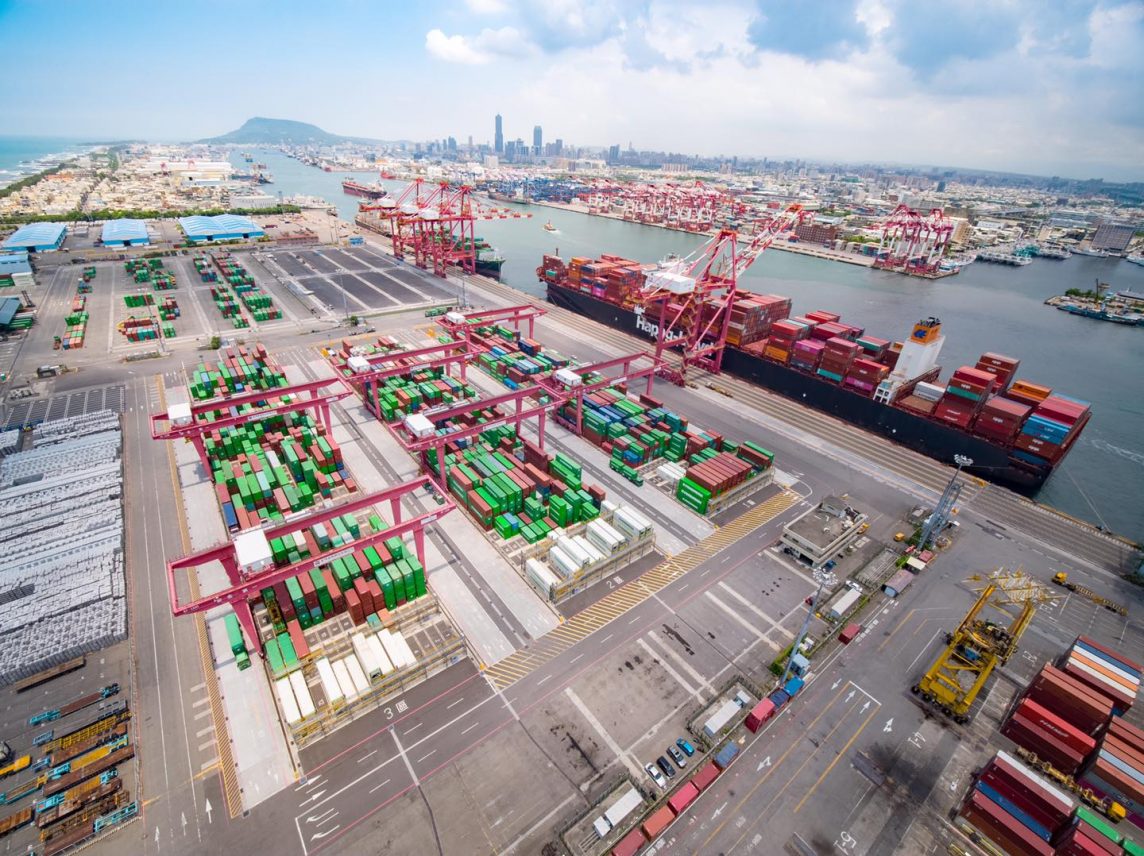
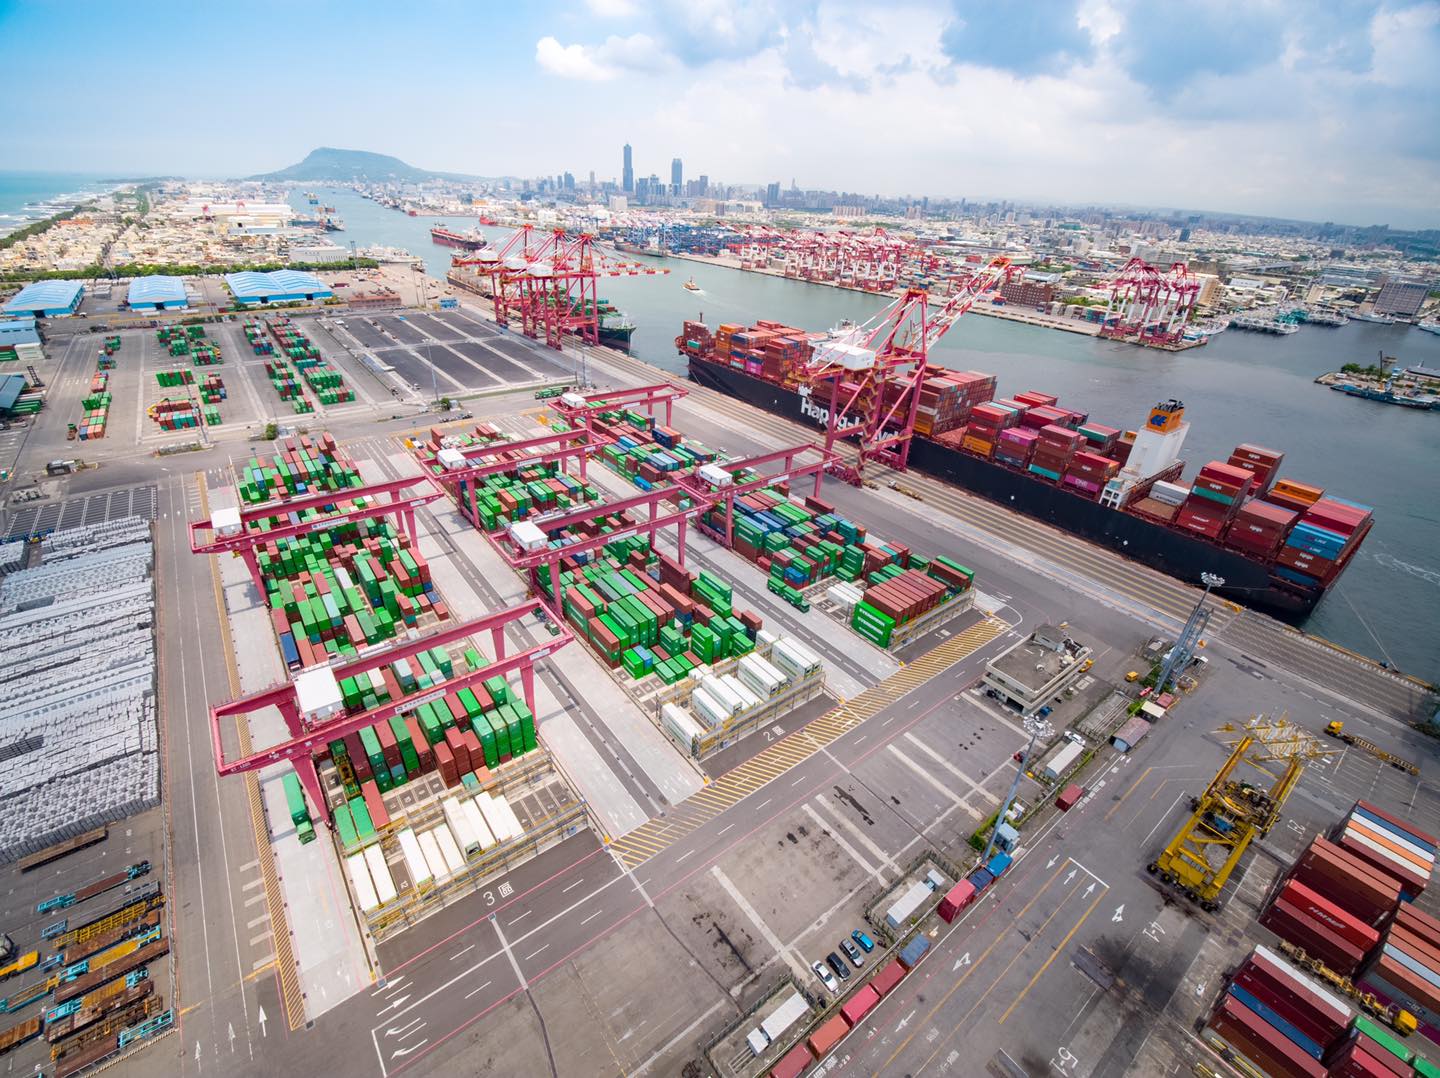
Taiwan’s main container port, Kaohsiung, is not among the ports listed in Gemini Cooperation’s service line-up, and in a recent interview with local media, Taiwan International Ports Corporation’s Kaohsiung branch’s CEO, Wang Chin-jung, said the port owner is paying close attention to Gemini’s service routes and the future direction of the existing alliances.

Wang pointed out that at present, Maersk mainly relies on the fourth and fifth container terminal, where HMM is operating facilities. Those were originally operated by Maersk’s terminal operating affiliate APM Terminals, before being novated to HMM.

Hapag-Lloyd, which is leaving THE Alliance to join Maersk, is now using fellow alliance member Yang Ming Marine Transport’s terminal in Kaohsiung.

While Hong Kong and Malaysia’s Port Klang have been left out, Linerlytica analyst Tan Hua Joo told Container News that this is unlikely to affect both ports.

Tan said, “There is only one existing call in Hong Kong by THE Alliance and this is expected to be retained after the departure of Hapag-Lloyd so it will have a minimal impact as far as Hong Kong’s volumes are concerned. Port Klang’s volumes will also not be materially affected.”

Meanwhile, South Korea’s main container port, Busan, expects to benefit as it will be among the port of calls for Gemini’s Asia-North Europe and Transpacific services. Busan will also be a transhipment centre for cargoes from China’s Bohai Sea, Dalian and Tianjin (Xingang) ports.

Hapag-Lloyd’s spokesperson told Container News that to improve reliability, certain ports have to be skipped.

He said, “The ambition with Gemini Cooperation is to deliver a flexible and interconnected ocean network with industry-leading reliability. By focusing each string on fewer key import and export ports, we significantly reduce the risk of delays along the journey, and we are supplementing the core ocean network with an extensive shuttle network allowing for fast, direct, and reliable connections for other ports.

“Customers should see a positive change to schedule reliability, and they are not expected to experience major changes to transit times. Please also note that, the future service maps are still subject to finalisation, including the new vessel schedules, and will be announced in due course once available.”

Source: Container News

READ MORE

PSA Singapore container throughput performance for 2023

PSA International Pte Ltd (PSA) enjoyed a record-breaking year as it handled container volumes amounting to 94.8 million Twenty-foot Equivalent Units (TEUs) across its port terminals around the world for the year ended 31 December 2023. Of which, PSA’s flagship terminal in Singapore contributed 38.8 million TEUs (+4.8%) and PSA terminals outside Singapore handled 56 million TEUs (+3.9%). Compared to the same period in 2022, the Group’s volume increased by 4.3%.

Mr Tan Chong Meng, Group CEO of PSA, shared, “Though there was a concerted push for economic recovery in many developed countries, the global economy remained fraught with turbulence in 2023 and the world continued to experience inflation, rising interest rates, tight labour markets, geopolitical tensions and ongoing wars, all of which destabilised the outlook for recovery and disrupted supply chains.”

“For exceeding expectations in the face of these challenges, I am extremely proud of our management, staff and unions who have worked tirelessly alongside our customers across PSA’s ports, cargo solutions, marine and digital businesses, to honour our commitment to service and operational excellence. I am equally grateful for the unwavering trust our customers and partners placed in us as we work closely together to keep cargo moving and trade flowing.”

Mr Tan added, “Looking ahead to 2024, the outlook for recovery of the global economy remains unclear, and the world braces itself for further potential geopolitical volatility. Keeping PSA’s strategic direction top of mind, the company will continue to focus on expanding our core business of ports and enabling more agile and resilient supply chains. Navigating the challenges to come, we will stay nimble to adapt to the uncertainties of the macroeconomic environment as we partner closely alongside our customers and stakeholders to be a supply chain orchestrator and bring about more sustainable global trade.”

Source: singaporepsa

READ MORE

Port of Melbourne handles nearly 270,000 TEUs in January

The Port of Melbourne reported an increase in total container throughput for January 2024 compared to the same month last year, totalling 269,044 TEUs.

Full container imports (excluding Bass Strait) showed growth from the previous year with higher volumes observed in furniture, metal manufactures, domestic appliances, and paperboard. However, full container exports (excluding Bass Strait) saw a decline in January 2024 compared to the previous year with wheat, cotton, miscellaneous manufactures, and dried milk all experiencing lower volumes.

Additionally, total empty container movements at the Australian port increased in the first month of the year compared to the previous year’s January figures.

Source: Container News

READ MORE

Top 10 Shipowning Nations

VesselsValue unveils this year’s top 10 shipowning nations, reviewing the total asset values for vessels by beneficial owner country. From Japan’s resolute leadership in the top position with a US$206.3 billion fleet to the emergence of Hong Kong at US$44.7 billion, asset values and ownership strategies have changed considerably over the last 12 months.

Japan

Japan continues to lead, taking number one spot owning the highest valued fleet and, holding a total of approximately US$206.3 billion in assets. This is an increase of c. 5% since the last report in November 2022.

Significant investment has taken place in the Tanker sector with almost 100 vessels added to the fleet, increasing the total value by 15.5%. In addition, values for this sector have continued to gain strength over almost all sub sectors and age categories over the last year. For example, 10 YO Suezmaxes of 160,000 DWT have increased by c. 19.8% year on year from US$53.43 mil to US$64.01 mil.

Out of the top ship-owning countries, Japan owns the highest value fleets for LNG and LPG vessels by both value at USD 37.8 bn and US$13.4 bn respectively and by volume at 202 LNG vessels and 344LPG. Japan also owns the largest and most valuable fleet for vehicle carriers with 334 vessels and a total value of US$22.9 bn.

China

Once again, China maintains its top position by vessel ownership, boasting a total of 6,084 vessels and a current fleet value amounting to USD 204 billion. China owns the largest Bulker fleet, both in terms of vessels and values. As a result of improved market fundamentals, earnings for Bulkers have been firm, particularly for the Capesizes. This has had a positive impact on values which have increased by c.30.36% year-on-year for newly built 0YO vessels of 180,000 DWT which have increased from US$54.75 mil to US$71.37 mil, the highest levels since March 2010.

China also owns the largest number of Tankers and Containers. The Tanker fleet consists of 1,576 vessels with a total value of US$47.4 bn and the Container fleet has 1,011 vessels, worth an impressive US$42.6 bn. Although the Container fleet has grown since the last time this report was put together, the value of the fleet has decreased by c.23.8%. This comes as the market has slowed significantly from the highs of 2022 and this has had an impact on values that have fallen across many sectors. For example, values for 20YO Handy Container vessels of 1,750 TEU, have fallen by c. 20.1% year-on-year from US$8.55 mil to US$6.76 mil.

Greece

Greece has maintained its position as the third-ranked country by both total number of vessels in its fleet and overall value. While China owns more Tankers, the Greek Tanker fleet has the highest value at US$69.5 bn, surpassing China by US$22.1 bn.
Over the last two years, the ongoing Russian sanctions and the resulting surge in tonne-mile demand have continued to bolster earnings for Tankers. In addition, the situation unfolding in the Red Sea is providing further support to earnings, at least in the short term. This has kept Tanker values hovering around the highest levels since 2010 for most sectors, for example, values for 15YO Suezmaxes of 160,000 DWT are currently up c.20.62% from the same period last year, from US$38.37 mil to US$46.28 mil.

Greece is also the owner of the second-largest LNG fleet, with 143 vessels and a fleet value of US$31.1 bn. The values in this sector have consistently remained at elevated levels since 2022, driven by a surge in demand.

United States
The United States has remained in 4th place with a total of US$99.9 bn, up over US$1 bn from our last report.

Of the overall asset value, US$49 billion is represented by cruise ships, solidifying the USA’s position as the world’s largest cruise owner. This is to be expected, given that the two leading cruise companies, Carnival and Royal Caribbean, have their headquarters in the USA. Despite a decrease in the fleet value by a total of US$4.7 billion since the last report, the USA maintains its dominance in the cruise industry.

The USA is also a prominent owner in the RoRo sector, with the largest fleet in terms of value, worth US$2.5 bn. However, with 40 vessels, the USA ranks behind Japan, who own 84 vessels.

Singapore

Singapore has retained 5th place once again this year, with a fleet value of c. US$85.7 bn and 4th place in terms of the number of vessels owned. Singapore’s Container fleet is the third most valuable globally, worth US$22.1 bn, accounting for almost a quarter of the value of the entire fleet.

Improvements in the LPG sector and stronger values have sparked an increase in sale and purchase activity for Singapore. The current valuation of the LPG fleet stands at US$9.3 billion, marking a substantial 57% increase from the last report. This surge elevates Singapore to the second position in terms of value within the LPG sector.

South Korea

South Korea has retained its place in 6th position this year, and the value of its fleet now stands at US$67 mil, an increase of just over US$1 bn since the last report was completed.
However, the country has moved out of the top 10 in terms of the number of vessels owned, overtaken by newcomers such as UAE, Russia and the Netherlands.

South Korea’s investment in the LNG sector continues to pay off, with values for this sector remaining firm and at high levels.

South Korea has maintained a pivotal role as a global car exporter and there has been considerable investment into the newbuilding sector. HMM placed an order of six LCTC vessels and an option for a further four more vessels to be built at Guangzhou CSSC and scheduled to be delivered between 2026-2028.

Norway

Norway has moved up to 7th place, surpassing Germany, with a total fleet value of US$59.3 bn. This has mostly been driven by investment in the Gas sectors and the value of the Norwegian LNG fleet increased by c. 16.7% since the last report from US$12.2 bn to US$14.2 bn. The value of the LPG fleet increased by c.55% from US$2.9 bn to US$4.5 bn, led by an increase in second hand sales and newbuilding orders. Over the course of 2023, Norway added 10 LPG vessels to the global orderbook, including an en bloc deal by Solvgang ASA who ordered five VLGC LPG vessels of 88,000 CBM from Hyundai Heavy Industries and scheduled for delivery in 2026-2027 and ranging in value from USD 107.41 mil to 106.65 mil.

Norway is also the second largest owner of vehicle carriers. The current value of this fleet stands at US$9.2 bn, up from US$8.2 bn, an increase of c.13% from the last report.

United Kingdom

After a brief period in 9th position, the UK has now moved back up to 8th place with a value of US$53.8 bn. The Cruise sector is the most valuable to the UK, accounting for c.25% followed by the Container sector with c.15%, this share has decreased significantly, due to a cooling in market sentiment and therefore values. Due to strong gains in the Tanker sector, the value of the UK Tanker fleet has increased by c.36.5% since our last report, moving up from US$5.2 bn in November 2022 to US$7.2 bn.

There has also been notable investment in the LPG sector and the value of this fleet has moved up from a value of US$2.9 bn in our last report to US$5 bn today, an increase of c.30%.

Germany

Germany has experienced a decline in its global rankings, dropping from 7th place to 9th place this year. A significant portion of its fleet has traditionally consisted of Containers, where Germany currently holds the second position in terms of the number of vessels. As earnings continue to undergo a correction following the boom of the early 2020s, values in this sector have also decreased. Consequently, the value of Germany’s fleet has fallen from US$32.1 billion in the last report to US$17.8 billion, representing a decrease of approximately 45%.

This year, Germany’s investment in the LNG fleet has increased in value by US$625 mil, to stand at US$1 bn.

Hong Kong, China

Hong Kong is a newcomer to the list with a total fleet value of US$44.7 bn. Notably, its significant investment in the Bulker sector has catapulted Hong Kong to the fifth position in the top 10 list. This sector alone contributes over a quarter of the total fleet value, approximately 29%, amounting to US$13 billion. This has been supported by strong Bulker values which have risen across all sub sectors for modern vessels, for example 5YO Capesizes of 180,000 DWT have by 32.14% year on year from US$42.53 mil to US$56.2 mil.

Source: Container News

READ MORE

Ensuring container fleet resilience with fuel flexibility

The Greenhouse Gas (GHG) targets set by the International Maritime Organization (IMO) and other regulatory vehicles, such as the Carbon Intensity Indicator (CII) and the Energy Efficiency Existing Ship Index (EEXI) have provided all ship owners and operators with parameters for meeting interim GHG targets in 2030, 2040 and, ultimately, achieving net zero by or around 2050.

The extension of the EU Emissions Trading System (ETS) in 2024, as well as the upcoming implementation of FuelEU Maritime requirements to limit carbon intensity from 2025, have put further pressure on owners and operators to implement emissions reduction measures now; and the general consensus across industry is that other regions will likely follow suit with similar initiatives in the coming years.

While these regulatory tools give industry and energy supply chains a clearer idea of where we are going, there are still significant questions about how to get there. In large part, the impetus is on vessel owners and operators to make both immediate and lasting change while there is still significant uncertainty surrounding the viability and availability of future fuels.

Moving into position

Vessel owners and operators are in an unenviable position, and it is important to recognise that the practical considerations of adopting future fuels and various other emissions reduction technologies and strategies differ across vessel segments. When it comes to future fuels, there’s no one-size-fits-all solution – nor will there be for some time to come.

Operators of container ships on liner routes, it could be argued, are at a relative advantage in making longer-term future fuelling decisions because they benefit from less variation in ports-of-call and therefore have more foresight over how to adapt to planned infrastructure and fuel availability along these routes in the coming years. For container ships on the tramp trades, there is less certainty.

Regardless, all owners and operators need to make emissions reduction decisions and investments today to stay on track with the regulatory schedule and reporting requirements, particularly CII ratings, which have an immediate impact on performance and the bottom line. Container ships are also facing unique pressure as their customers and end consumers are making tougher demands as they hope to lower the indirect Scope 3 emissions from across their value chain. Here, there is a lot of work to do.

In 2022, Wärtsilä performed an analysis of the global fleet that revealed some startling conclusions. Firstly, more than one-third of container ships are already likely to be non-compliant with CII requirements to maintain an A-C rating, falling into categories D and E. Secondly, the analysis showed that by 2030, if no action is taken, 80% of container ships will be in category E and therefore non-compliant.

Future-proofing container shipping

When it comes to finding the right solution for significantly reducing emissions, one catch-all strategy revolves around exploring solutions that prioritise fuel flexibility and efficiency. This ensures operators utilise a range of fuels depending on their future scalability and suitability for individual vessels and fleets over the vessel lifecycle without being tethered to a single-fuel solution.

In short, ‘fuel-flexible’ engines capable of running on conventional bunker fuels as well as transitional and alternative future fuels – notably LNG, biofuels, methanol and ammonia – enable owners and operators to overcome the uncertainty of changing market dynamics and uncertainty around fuel availability and cost in the future.

Of course, careful decisions need to be made about which fuel-flexible system to adopt for each vessel, which is why working closely with engine manufacturers is crucial. With all alternative fuels, there are practical considerations unique to container vessels that need to be considered. Methanol engines may require almost double the fuel tank capacity compared to diesel, meaning either larger fuel tanks which could take up cargo capacity, or more frequent bunkering. There are storage and handling considerations, too, with ammonia, needing attention given it is a highly volatile and corrosive fuel.

Utilising methanol and ammonia-ready engines, such as those unveiled by Wärtsilä in 2023, can enable the crew to seamlessly transition between different fuel types with minimal modifications and without power interruption, increasing the choices available.

These new future-fuel-ready engines can significantly enhance regulatory compliance through reduced emissions output. Wärtsilä’s methanol engine range can reduce tailpipe CO2 emissions by up to 7% against EEXI and CII indexes, alongside a 60% nitric oxide (NOx) and 99% sulphur oxide (SOx) reduction. Considering a well-to-tank approach – which may be introduced by the IMO – a reduction of up to 88% could be possible for green methanol.

The four-stroke Wärtsilä 25 Ammonia-ready engine can produce an immediate greenhouse gas emissions reduction of at least 70% compared to a similar sized diesel engine on a well-to-wake basis, using green ammonia.

Foresight ensures future competitiveness

Taking an existential perspective, fuel-flexible propulsion systems are going to be essential to getting maritime to net zero. In a generally conservative and risk-averse industry, fuel-flexible approaches provide a solution for reducing emissions today and give wider supply chains the real-world intelligence and impetus to make future fuels available at scale.

READ MORE

Rotterdam sees TEU decline amid stable financial results

The Port of Rotterdam handled 13.4 million TEUs in 2023, translating to a 7% drop compared to the previous year’s figures. Additionally, the container throughput in tonnes was 130.1 million tonnes, lower by 6.8%.

“Container throughput has proved to be very volatile in recent years in response to Covid and geopolitical developments,” said a Port of Rotterdam official, adding that the main reasons for the decline that began in 2022 and continued in 2023, are “lower consumption, lower production in Europe and the discontinuation of volumes to and from Russia pursuant to the sanctions.”

Additionally, the Roll-on/roll-off traffic (RoRo) fell by 5% to 25.9 million tonnes, while the break bulk sector saw a 15,1% decrease, largely attributable to the decline in container rates, resulting in more cargo being shipped in containers rather than as break bulk.

Furthermore, the throughput of dry bulk in 2023 was 11.8% down from 2022, while liquid bulk throughput was 3.4% lower than last year.

However, the Port of Rotterdam Authority reported financial stability with its revenues rising by 1.9% to €841.5 million,  operating result before interest, depreciation and taxes (EBITDA) increasing by 0.9% to €548.6 million and the net result falling by 5.6% at €233.5 million.

“The lower net result was attributable to two one-off items in 2023,” pointed out the Port Authority, explaining that “acquired nitrogen deposition rights were revalued downward (€8 million) in response to the ruling from the Council of State relating to the 25-kilometre cut-off. In addition, the Porthos guarantee premium (€7.3 million) was booked, leading to a lower result for participating interests.”

The Port Authority invested a total of €295.4 million during the previous year, almost 15% more than in 2022. The largest investments were the investments in quay walls for the container sector (€72.9 million), land reclamation for the Prinses Alexiahaven (€23.1 million) and the fendering in the Rozenburg lock (€12.8 million).

Boudewijn Siemons, CEO of the Port of Rotterdam Authority, stated, “2023 saw ongoing geopolitical unrest, low economic growth due to higher interest rates and faltering global trade, all of which had a logical effect on throughput in the port of Rotterdam. However, the year also saw many major investment decisions and milestones in the transition to a sustainable port.”

Source: Container News

READ MORE

Expanding supply to put brakes on rates

A rise in container capacity will halt the increase in freight on the major east-west trades according to Drewry’s latest tool, the Container Capacity Insight (CCI), launched on 20  February.

A surge of 8% month-on-month across all three major east/west trades from February to March this year can be broken down into a surge in capacity of 11% from Asia to west coast North America and a contraction of 14% from South Asia to North Europe.

The CCI shows Atlantic rates surging 10% this week, but Pacific rates easing and Asia to Europe levels falling even as carriers blank sailings slow vessels in a bid to cut capacity, but also to re-align schedules following the diversion of vessels around the Cape of Good Hope.

Overall, the expectations from most industry observers and analysts is that rates will slow as capacity continues to be delivered and demand fails to keep pace in challenging global economic circumstances.

“It is always the fundamentals that counts,” noted Darron Wadey, analyst at Dynamar.

“It is fair to say that freight rates have definitely risen with some headline indices around double those of one year earlier, and route-specific indices as Asia-Europe and the Pacific performing (much) better than that even,” he added.

Nevertheless, Wadey believes these rate increases are a reflection of the extra costs from diverting around the Cape for Asia-Europe and Asia-US East Coast, put at around US$10 million or around US$1,000/FEU on a 20,000 TEU ship, rather than a tight supply/demand equation.

One forwarder confirmed that Asia to Europe rates were hovering at around the US$4,000/FEU level, with forward tariffs now being valid for two weeks, rather than a week, and no diversions charges added to the total.

Even if carriers manage to tie shippers into high-cost long-term contracts there is a danger that when spot rates fall below the contracted level, shippers will want to shift to the new rate, believes Wadey.

That is not the view of all the market observers with Linerlytica claiming: “The bullish market sentiment has not been dampened by the Lunar New Year break with carriers still retaining most of their recent rate gains, defying the predictions of a post-holiday correction.”

Asked about this bullish outlook, Linerlytica took a softer tone: “We are not suggesting that freight rates are not going to fall. A post-holiday correction is certainly to be expected, but the key question is how sharp will the drop be and for how long?

“At this point, rates are still holding up relatively well and the Red Sea diversions will keep capacity tight at least for the next three months,” explained a spokesperson for Linerlytica.

Not surprisingly James Hookham, director at the Global Shippers’ Forum, believes there is “no fundamental pressure on rates”. Referring to the shortage of boxes raised as a reason to raise rates recently, he quipped, “the lines have found their boxes”.

Hookham claimed his members are not talking about rates increasing at the moment, but rather that the situation has plateaued, and even peak season surcharges have moderated or in some instances disappeared altogether.

Hookham did shippers, however, to be aware when signing contracts because vessel operators have said they will resume sailing via Suez, at the earliest possible time. “Shippers should consider only signing three-month deals or adding a ‘return to Suez rate’ to the contract to cover this eventuality,” said Hookham.

Meanwhile, Peter Sand, Xenata’s chief analyst, is clear: “What we see going into March is carriers are pushing for GRI to get implemented, that would lift rates – as of now, they don’t seem to be very successful in doing that.”

Pacific rates peaked in early February, and they have slowly declined since, said Sand, while also conceding that eastbound Pacific rate are currently at an 18-month high at US$4,700/FEU to the US west coast.

“Long-term rates are up by 25% since end-September 2023. Carriers appear to be a in comfortable position – as compared to anything – but specifically due to Red Sea disruption,” stated Sand.

However, Xenata are not expecting rates to soar in the coming year with the fundamental outlook still tough on the carriers.

Supply-side estimates for January are up by 6.8% year-on-year said Sand, adding: “We have no solid numbers on demand for January yet – but if we go with 16.9% you would still not see demand higher than 2021 and 2022, as Jan ’23 was at least a five-year low point.”

He concluded: “Carriers ability to manage capacity is a key element in 2024 and 2025 – but to me, it appears as if rates into the US may have peaked, then flatlined. What comes about in March? a small uptick maybe, then a slide probably.”

Source: Container News

READ MORE

Welcome back from Lunar New Year break

We hope you had a rejuvenating and joyful Lunar New Year celebration filled with cherished moments with family and friends. Now that we’ve recharged our batteries and embraced the spirit of renewal, it’s time to dive back into the excitement of work!

OUR ADVANTAGE SERVICES:
🔸 LCL NVOCC
🔸 Sea Freight
🔸 Air Freight
🔸 Breakbulk
🔸 Customs Clearance
🔸 Domestics Transportation
🔸 Warehouse

Our dedicated team of professional provide professional advice, top-notch logistics solutions and customer service excellence because your business is our business. YOUR CARGO? NEVER SAY NEVER.

Hope to a prosperous and successful year ahead! 🚀💼
————————
MAC-NELS VIETNAM
🏛 Ho Chi Minh Office: 28 Mai Chi Tho St., An Phu Ward, Thu Duc City, Ho Chi Minh City
☎ +84-28 3911 9090
🏛 Hanoi Office: 119 Tran Duy Hung St., Trung Hoa Ward, Cau Giay Dist., Ha Noi City
☎ +84-24 320 22 030
🏛 Hai Phong Office: 03 Le Thanh Tong St., May To Ward, Ngo Quyen Dist., Hai Phong City
☎ +84-225 883 0451
🏛 Da Nang Office: Muong Thanh Luxury Song Han, 115 Nguyen Van Linh St., Hai Chau Dist., Da Nang City
☎ +84-236 3633 069
📧 sales@macnels.com.vn
READ MORE

CONSOL SERVICES (DIRECT/VIA SIN) FROM/TO SINGAPORE

⏰ 𝐄𝐓𝐃: WEEKLY
📆 𝐓/𝐓𝐈𝐌𝐄: 2-5 DAYS
⚓ 𝐂𝐀𝐑𝐑𝐈𝐄𝐑: YML / I CARRY
⚓ 𝐕𝐈𝐄𝐓𝐍𝐀𝐌 𝐏𝐎𝐑𝐓𝐒: HO CHI MINH / HAI PHONG / DA NANG
Get instant booking confirmation below:
𝗠𝗔𝗖-𝗡𝗘𝗟𝗦 𝗩𝗜𝗘𝗧𝗡𝗔𝗠
🏛 Ho Chi Minh Office: 28 Mai Chi Tho St., An Phu Ward, Thu Duc City, Ho Chi Minh City
☎ +84-28 3911 9090
🏛 Hanoi Office: 119 Tran Duy Hung St., Trung Hoa Ward, Cau Giay Dist., Ha Noi City
☎ +84-24 320 22 030
🏛 Hai Phong Office: 03 Le Thanh Tong St., May To Ward, Ngo Quyen Dist., Hai Phong City
☎ +84-225 883 0451
🏛 Da Nang Office: 115 Nguyen Van Linh St., Hai Chau Dist., Da Nang City
☎ +84-236 3633 069
📧 sales@macnels.com.vn
READ MORE

Vietnam optimistic about economic growth in 2024

Although the 6-6.5 percent economic growth target for 2024 is challenging, the Government is highly determined to implement strong measures and strategies to reach the set goal.

Government’s determination

On November 9, 2023, the National Assembly officially passed a Resolution on the Socioeconomic Development Plan for 2024. Accordingly, the gross domestic product (GDP) growth target for 2024 is 6-6.5 percent, a goal that requires great efforts and strong determination. Recent forecasts from many international institutions indicate that the global economy in 2024 still faces numerous unpredictable risks, especially the Russia-Ukraine and the Israel-Hamas conflicts, which show no signs of ending. Nevertheless, reputable domestic and international economic research organizations have provided different forecasts regarding the growth prospects of Vietnam’s economy in 2024. They all have confidence in the efforts and results that the economy will achieve in 2024.

The Vietnamese Government has demonstrated a high level of determination in implementing strong measures to achieve the set goals. Under the guidance and leadership of the Party, effective State management, the efficient functioning of the National Assembly, and the resolute governance of the Government and the Prime Minister, the spirit of listening and timely response has been emphasized. Many proactive solutions have been issued and implemented to promote economic development, ensure stability, and improve the livelihoods of the people.

In the first 11 months of 2023, the Government issued 78 decrees and 236 resolutions, while the Prime Minister issued 29 legal normative decisions, 1,575 individual decisions, and 28 instructions. Among them were practical measures such as reducing lending interest rates, stabilizing the foreign exchange market, accelerating disbursement of public investment capital, implementing credit support packages for sectors and industries, granting tax exemptions, reductions, and extensions, as well as providing assistance to businesses, and extending visas for tourists. Additionally, the Government actively and effectively engaged in various foreign activities and international integration efforts, especially in building and implementing high-level agreements. These efforts will contribute to creating the momentum for growth in 2024 and ensuing years.

It is worth noting that the Government has recently issued a Resolution on the key tasks and solutions to improve the business environment and enhance national competitiveness in 2024.

The Resolution’s general objective is to significantly improve the quality of the business environment, aiming to enhance Vietnam’s position in international rankings. It aims to create a healthy competitive environment, increase the number of newly established enterprises rapidly, reduce the proportion of temporarily suspended businesses, and increase the number of enterprises engaged in innovation, green transformation, and digital transformation. Additionally, it focuses on reducing input costs and compliance costs in investment and business activities, mitigating policy risks, strengthening trust, creating recovery footholds, and enhancing the resilience of businesses.

Making the most of opportunities

Regarding Vietnam’s economic prospects in 2024, Dr. Nguyen Lam Thanh, Vice Chairman of the National Assembly’s Council for Ethnic Affairs, said that the government’s decisive solutions, along with several resolutions of the National Assembly, have been issued in a timely manner. Vietnam’s economic indicators have shown signs of recovery. Specifically, the industrial sector has experienced good progress. The agricultural sector has created high export values, with rice, fruit and vegetables leading the way. There has been a notable progress in public investment disbursement.

Similarly, Tran Van Lam, Member of the National Assembly’s Finance and Budget Committee, holds a positive view on Vietnam’s economic prospects in 2024. According to him, the implementation of the economic recovery package in 2022-2023 will yield results in the period from 2024 onwards. Specifically, the mechanisms and policies implemented in 2023 will contribute to the economic recovery. Moreover, the strong disbursement of public investment at the end of 2023 and in 2024 will boost domestic consumption and create a ripple effect in the economy. Therefore, achieving a GDP growth rate of 6-6.5 percent is entirely feasible.

To realize the growth targets, Resolution 01/NQ-CP outlines the following main tasks and solutions for implementing the socioeconomic development plan and state budget estimate for 2024:

Firstly, prioritize promoting economic growth, maintaining macroeconomic stability, controlling inflation, and ensuring major balances.

Secondly, continue to review and improve institutions, laws, mechanisms, and policies related to enhancing the effectiveness and efficiency of law implementation; streamline and simplify administrative procedures and business regulations.

Thirdly, strengthen the construction and development of a comprehensive and modern strategic infrastructure system, especially highways, airports, seaports, urban infrastructure, regional infrastructure, digital infrastructure, social infrastructure, healthcare, and education.

The credit rating agency Fitch Ratings has forecast that Vietnam’s economic growth will reach 6.3 percent in 2024 and 7.0 percent in 2025.
READ MORE