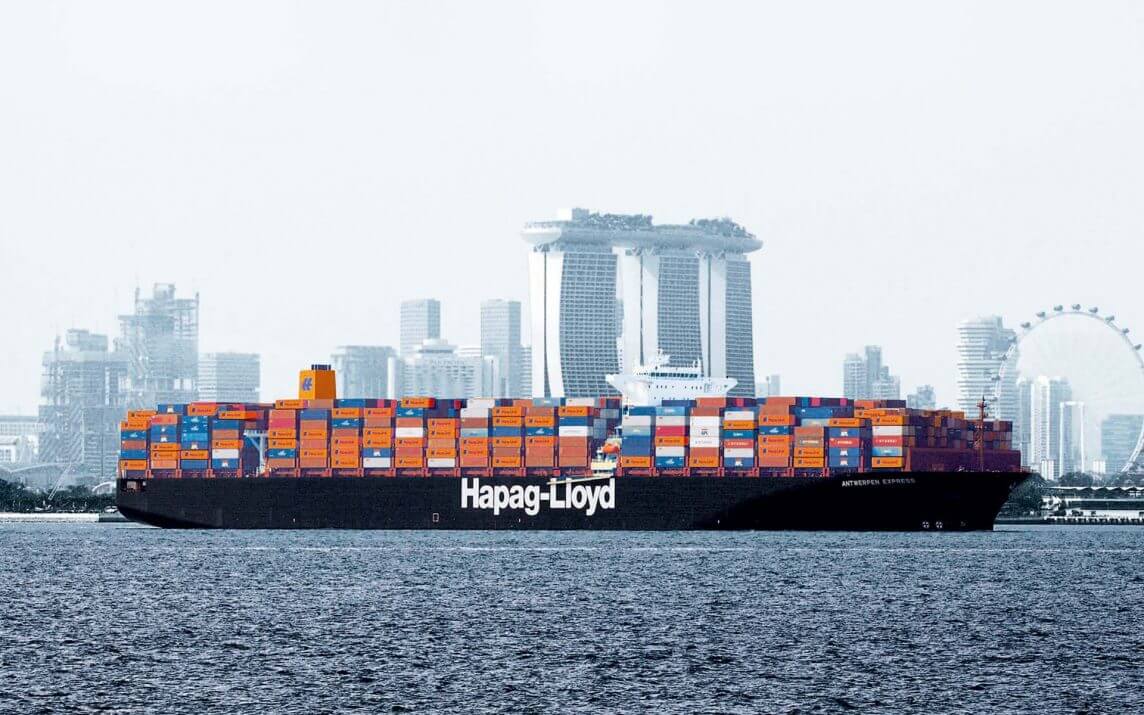
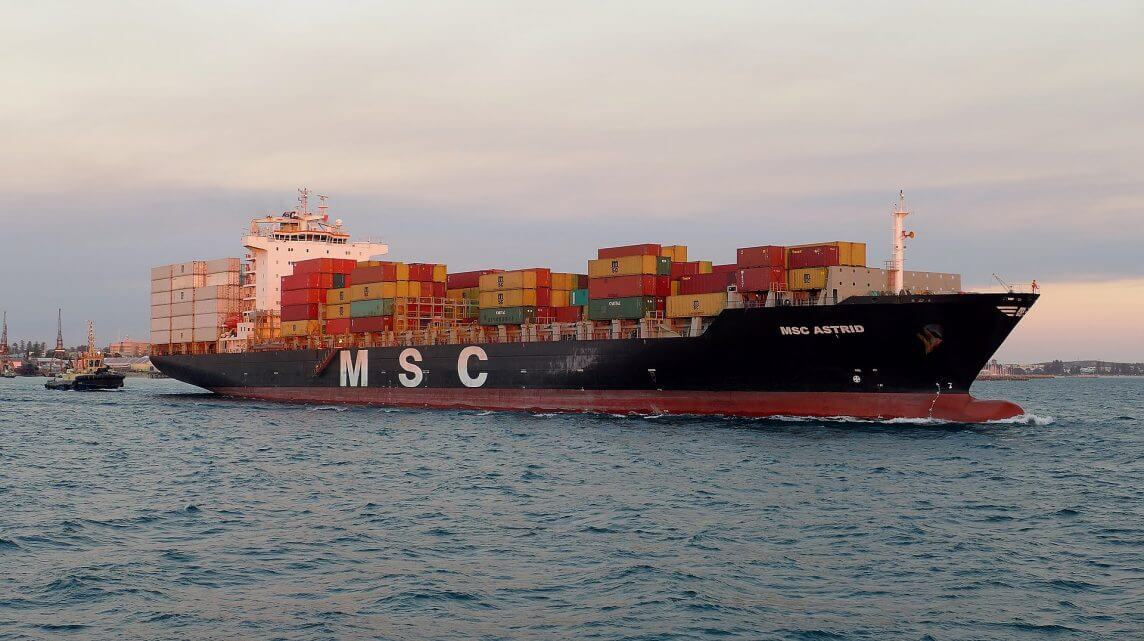
Hapag Lloyd has announced new rates for Australian destinations that will take effect in the next months.
 Firstly, the German carrier will implement a peak season surcharge (PSS) of US$500 for 20′ and US$1,000 for 40′ all dry, reefer, non-operating reefer, tank, flat rack and open-top containers. This surcharge will be applicable from 1 August for sailings starting from Taiwan.
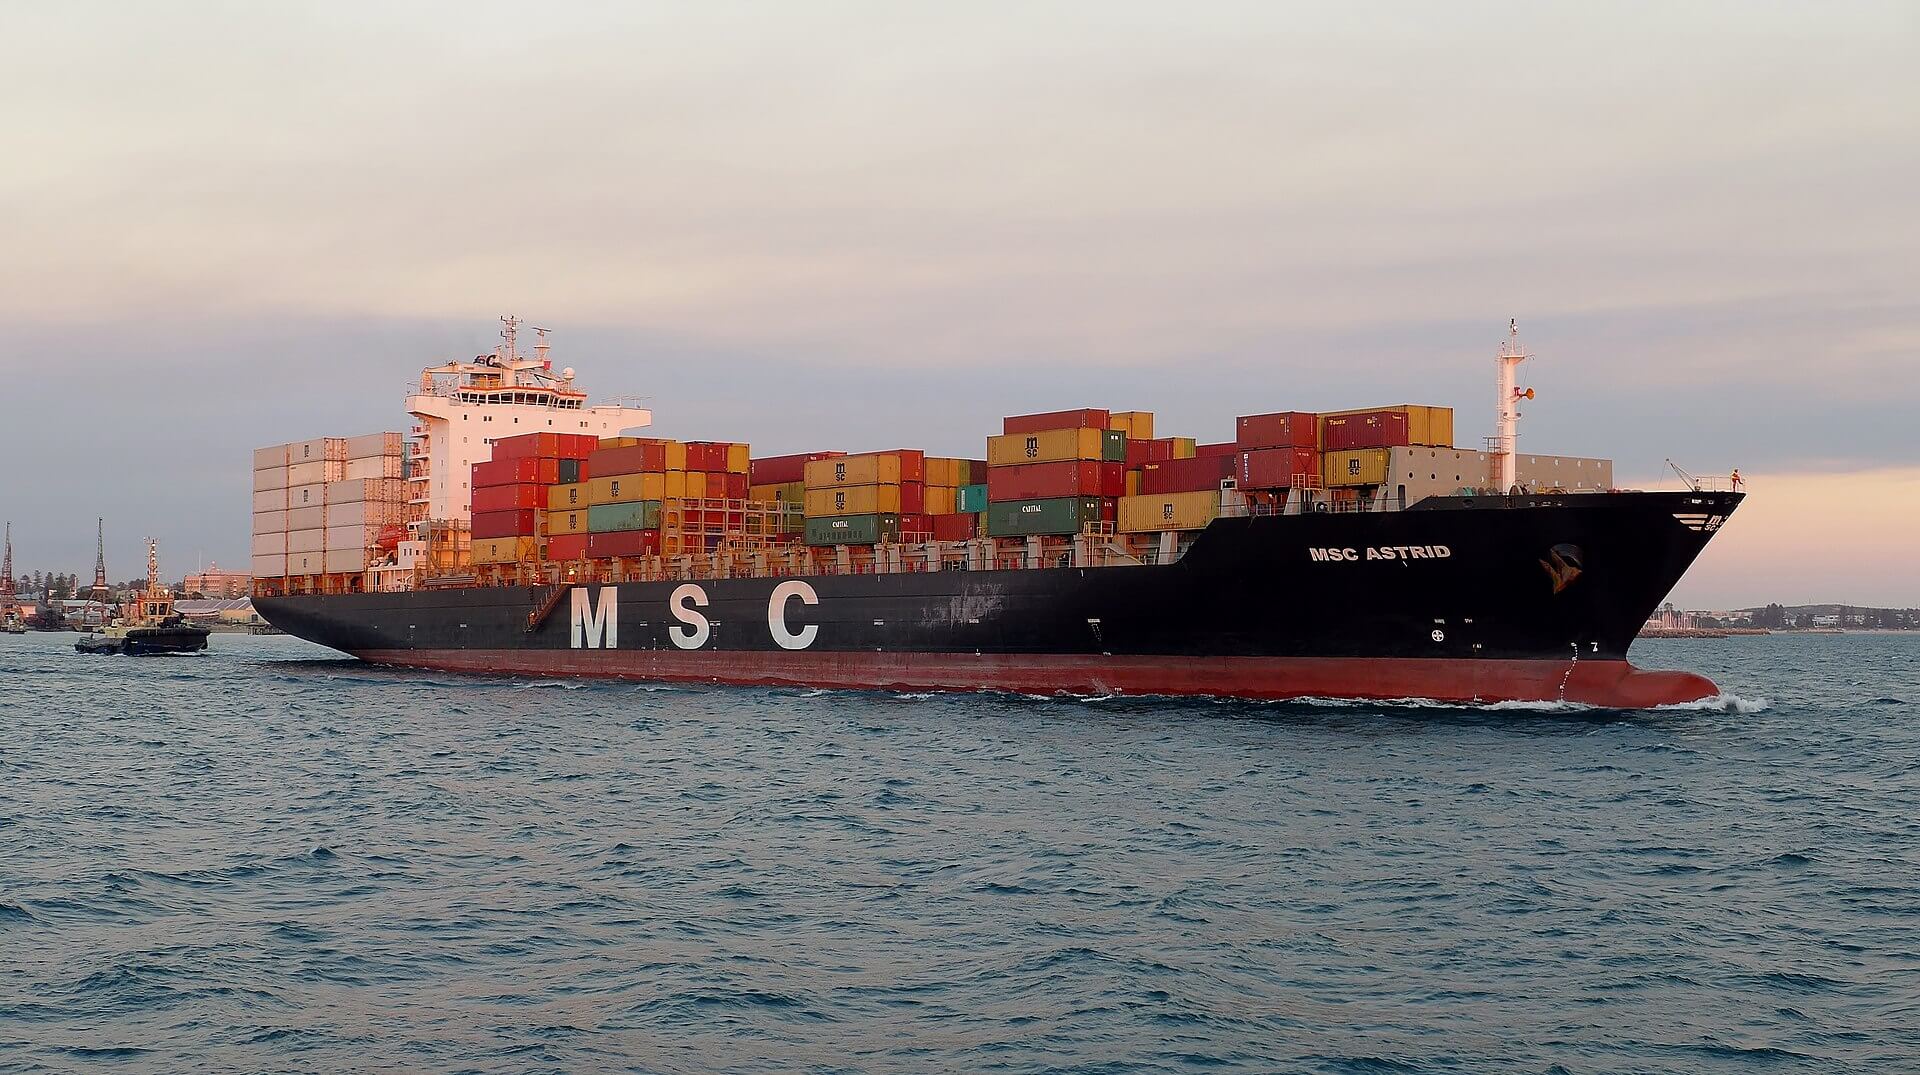
One month later, the Hamburg-based box line will introduce the same level of surcharge for all the container types from China, Macau and Hong Kong to Australia.
Additionally, Hapag-Lloyd will set an increased ocean tariff rate for standard and reefer boxes, including high cube containers, from North Europe and the Mediterranean to Australian base ports Adelaide, Brisbane, Fremantle, Melbourne, Sydney.
Effective from 1 August, the new rates will be as follows:
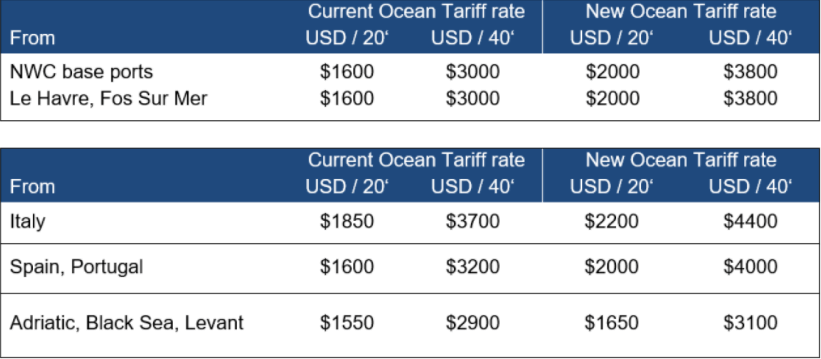
New rates for standard containers
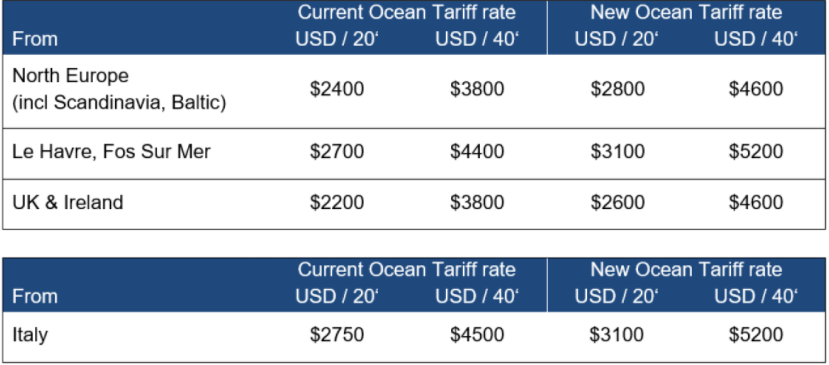
New rates for reefer containers
Source: Container News

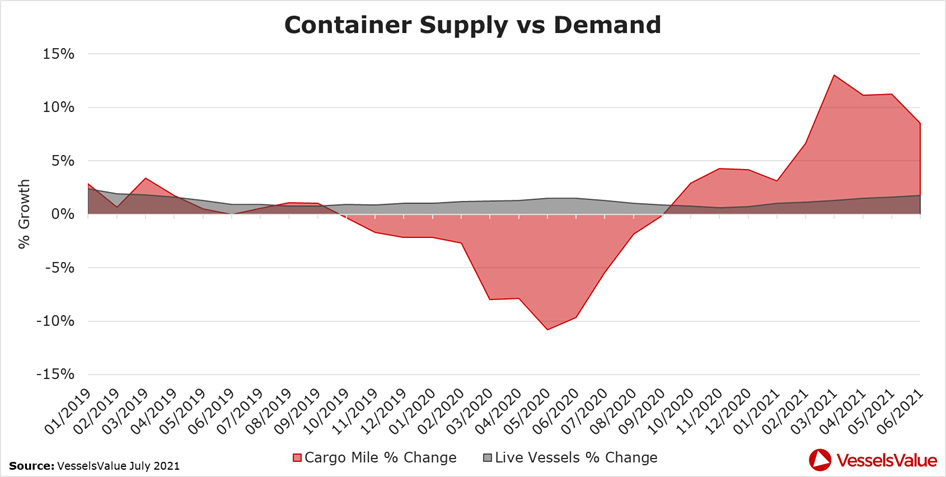

 Global shipping has been facing erratic consumer demand, factory shutdown, and pandemic restrictions that have hampered port operations for months. As an outcome, empty containers are scarce where they are needed.
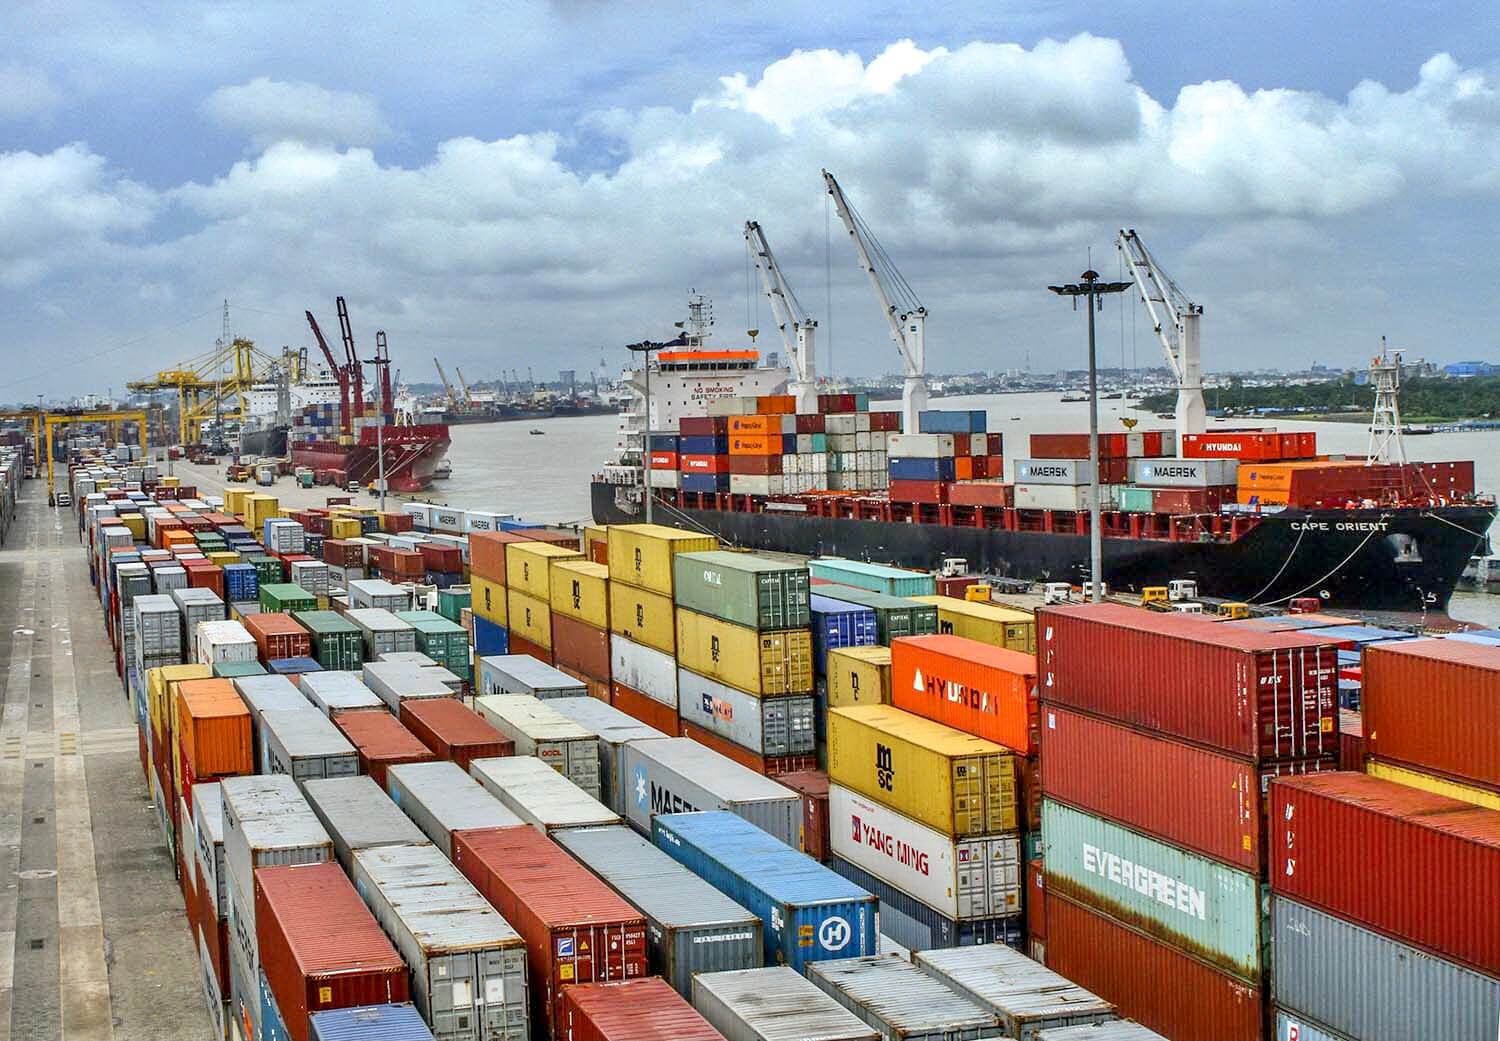
 Lead Time and Transit Days
 The Swiss container carrier said the new charges will be effective from 1 August until further notice but not beyond 31 August 2021.
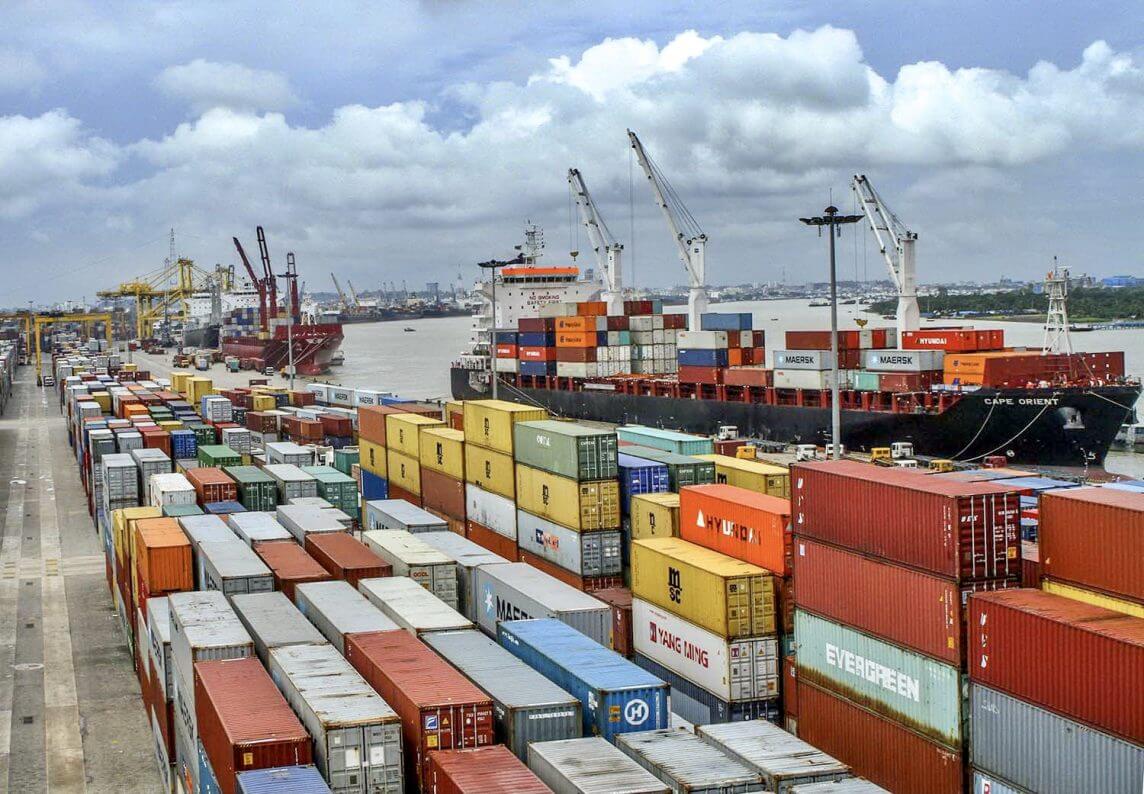

