Need a quotation?

Dear Customers, if you wish to receive a quotation, we kindly ask you to fill in below form. Once the form has been duly filled and submitted, the rates will be quoted to you.

SEARCH SITE BY TYPING (ESC TO CLOSE)

Skip to Content

About: lambui

Recent Posts by lambui

Japan-US container exports near 55,000 TEUs in October

Japan’s container exports to the United States reached 54,409 TEUs in October, translating to a 7.9% increase over the same month in 2022. On the other hand, they fell 10% from the previous month’s figures.

Direct exports accounted for 36,181 TEUs, representing a 25% year-over-year increase, while transshipment exports declined by 15% to 18,228 TEUs.

Containers transshipped in South Korea plunged 15.8% to 11,945 TEUs due to the launch of a new service from Yokohama to the US East Coast, while China was responsible for 2,539 TEUs, down 10.2%, and Taiwan, 2,007 TEUs, down 8.8%.

Meanwhile, Japan’s imports from the United States reached 49,433 TEUs in September, a 4.3% decrease from the same month in the previous year. They were made up of 40,153 TEUs of direct shipments, an increase of 0.4%, and 9,280 TEUs of containers carried via third countries, a decrease of 20.5%.

Transshipped in South Korea amounted to 5,061 TEUs, down 14.1%; in Taiwan, 2,380 TEUs, down 40.2%; and in Singapore, 771 TEUs, down 21.6%.

By port of destination, 15,442 TEUs were imported to Tokyo, up 8.7%; 11,271 TEUs to Yokohama, up 18.4%; 8,469 TEUs to Kobe, up 5.5%; 5,156 TEUs to Nagoya, up 20.4%; and 1,045 TEUs to Osaka, up 36.6%.

Source: Container News
READ MORE

Carriers on India-US trade attempt higher rate hikes for December

Container carriers serving India-US trades seem to have regained some strength to attempt higher rate increases amid promising export trade indications.

CMA CGM has doubled the amount of a previously announced peak season surcharge (PSS) for December on shipments from India to the US East and Gulf coasts.

The French liner, in a new customer advisory, said a PSS of US$200 per container that was to take effect from 1 December will be revised upwards to US$400 per container, from 15 December.

“The PSS applies to tariff or service contract rates for all cargo moving under the scope of the tariff,” CMA CGM (India) said.

Other carriers like Hapag-Lloyd and Mediterranean Shipping Co. (MSC) could follow suit, according to market sources. Hapag-Lloyd on 14 November announced plans to implement a general rate increase of US$200 per container on this trade lane, starting 15 December.

The German carrier said cargo loads from Mundra, Nhava Sheva, Pipavav and Hazira to USEC will attract this GRI.

CMA CGM and Hapag-Lloyd together operate the Indamex network between West India and USEC through consortium arrangements.

Thanks to a few void calls announced by India-USEC services this month, loading capacity out of Nhava Sheva and Mundra has tightened on recent vessels, enabling major carriers to at least raise spot rate levels.

Indian ports reported a 5% increase in container volumes during October, month-on-month, according to new data. Combined throughput hit 1.9 million TEUs, from 1.8 million TEUs during September, according to data obtained by Container News.

India’s merchandise exports, by value, in October saw a 6.2% increase, reaching US$ 33.6 billion, according to new government data.

“This suggests that the export sector is on the road to recovery due to the resilience shown by it,” said A. Sakthivel, president of the Federation of Indian Export Organisations (FIEO) in a statement.

FIEO also noted, “Demand is still an issue in many markets due to high inventory and growth reflects that we may be eating into the share of some other countries.”

Sakthivel went on to add, “The tension in West Asia had also made businesses and markets sceptical and nervous, but the conflict will have a limited impact unless it escalates, and more countries join in.”

He also explained, “While goods exports growth has remained somewhat sombre, services have continued on with its momentum and maintained a rising trend, helping to narrow the overall trade deficit and keeping the current account deficit under check.”

Source: Container News

READ MORE

Container shipping to bear brunt of EU Emissions Trading System

Container shipping will be the hardest hit shipping sector in January when the European Union Emissions Trading System (EU ETS) goes live with the carriers liable for around €1.82 billion in carbon charges at today’s prices, by 2026.

The EU ETS will be introduced gradually from 2024, with carriers liable for 40% of emissions in the first year, rising to 70% in 2025 and 100% by 2026, and Albrecht Grell, MD at OceanScore said the bill for the EU ETS will total around €6.5 billion, depending on the cost of EU Allowances (EUAs), calculated using today’s fleet deployments.

Moreover, Grell, speaking at the launch of tech start-up OceanScore, responding diplomatically to questions regarding a global market-based measure (MBM) said, “I do not believe that the framework at the IMO is sufficiently large enough for a global MBM to be accepted by the nation states.”

More likely, according to Grell is the proliferation of regional MBM measures with all the challenges that will create for both shipping, which will have to navigate multiple regulations, and the regulators, who will need to decide who profits from the carbon charges and where the boundaries lie for each jurisdiction.

Container shipping lines have said that the charges levied from the EU ETS will be passed on to shippers and forwarders, with Evergreen announcing charges of €27/dry container and €41/reefer on the Asia to Europe trades. Similar charges will be levied by most other lines.

However, the EU ETS will create another accounting clerical management requirement for the lines and Grell was in London to outline a possible solution for the carriers to manage the new regulatory requirements.

OceanScore is a one-stop automated system for dealing with payment of EUAs and managing the EU ETS, although Grell acknowledges that there will always be manual inputting of a limited amount of the data, mainly due to the access requirements to the Union Registry, where EUAs are acquired.

According to Grell, a number of functions around the EU ETS remain to be clarified, including which facilities are considered transshipment ports, thereby clarifying the last port of call for EU ETS purposes and who is liable for buying the EUAs, the owner or ship manager, while many charters have yet to be modified to account for the new regulation.

Moreover, there will be a need for the carriers to take cash payments and buy EUAs, while the responsibility for buying the correct number of EUAs, estimated at 6,000 per vessel per European port call.

Managing the system will require trained and dedicated staff said Grell, putting OceanScore at the forefront of meeting those challenges, which has been recognised by such companies as MSC and vessel owner Peter Döhle.

Matthias Bloete, director of finance, controlling & corporate development at Döhle explained why the company had decided to partner OceanScore, “Although OceanScore is a start-up it has a hugely experienced team with many years of shipping experience, which means that the solution has practical processes and the handling and usability is very good.”

Source: Container News

READ MORE

Port of Long Beach and Long An International Port sign collaboration agreement

Mr. Vo Quoc Huy, Chairman of Long An Port JSC, and Mr. Mario Cordero, Chief Executive Officer of Port of Long Beach, signing the Letter of Intent at 5:00 p.m., November 15, 2023 in San Francisco, California, USA

Vietnam’s Long An International Port and California’s Port of Long Beach signed a letter of intent on 15 November to establish a sister port relationship, aiming to explore opportunities for collaboration, sharing of experiences in port management and operation, improving market connectivity to increase transshipment cargo volume and long-term development.

“We are glad to welcome the delegation of Long An Province and leaders of Dong Tam Group attending the Conference of California Association of Port Authorities (CAPA) are pleased to sign a Letter of Intent with Long An International Port. This signing ceremony demonstrates our desire to promote the signing of cooperation agreements not only for trade purposes but also towards sustainable development, emissions reduction, and environmental friendliness,” stated Mario Cordero, CEO of Port of Long Beach.

The Long An Provincial delegation, led by Vice Chairman of the Provincial People’s Committee Nguyen Minh Lam and Vice Chairman of the Provincial People’s Council Mai Van Nhieu, aims to connect businesses in Vietnam and US localities in the fields of industry, digital transformation, import-export services, logistics, and education, among others, within the framework of the program to visit and work in the United States.

The cooperative partnership between Vietnam and the United States has made significant progress with activities promoting economic-trade-investment cooperation having brought together many interested agencies, associations, and businesses from both countries with the goal of promoting bilateral cooperation based on foreign relations as a result of the two countries’ close relationship following their upgrade to a comprehensive strategic partnership.

READ MORE

Greeks and Chinese dominate global fleet market

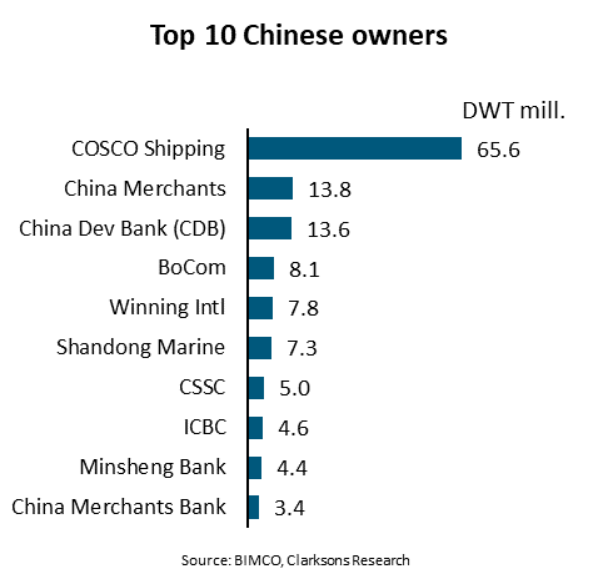
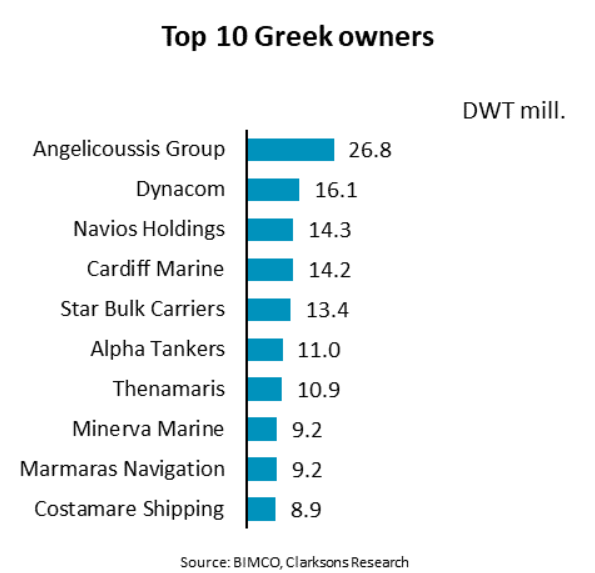
“The global fleet of cargo carrying ships consists of around 61,000 ships with a deadweight capacity of about 2,200 million tonnes. The ships owned by Greek and Chinese shipping companies contribute 34% of the total fleet’s deadweight tonne capacity,” says Niels Rasmussen, chief shipping analyst at BIMCO.

Although consolidation has been significant within the container shipping segment, the overall shipping market is still very fragmented, and the average shipping company only owns a few ships. Over time, key shipping nations have, however, emerged. Some have since lost importance due to shifts in global trade, but Greece has remained the world’s foremost shipping nation.

More recently, China’s importance as a shipping nation has grown and Chinese shipowners now jointly control the world’s largest merchant fleet. The country also currently owns the second largest fleet of cargo carrying ships.

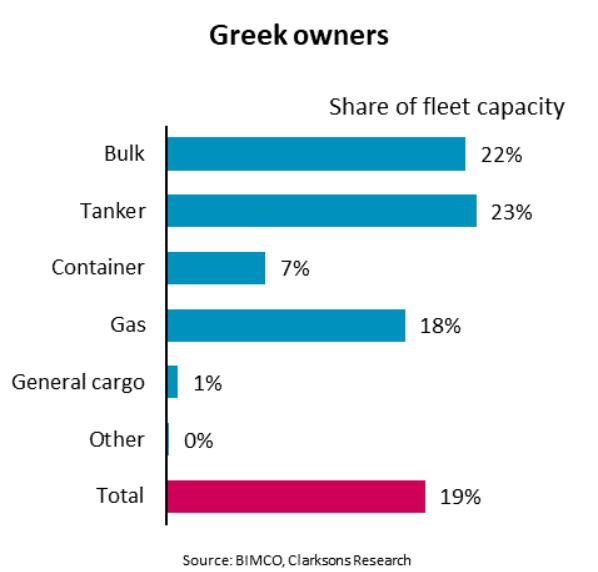
“Measured by cargo capacity, Greek shipowners control the world’s largest fleet of cargo carrying ships. In total, they control 19% of the cargo carrying capacity and maintain a particularly high share within the dry bulk, tanker, and gas carrier sectors,” says Rasmussen.

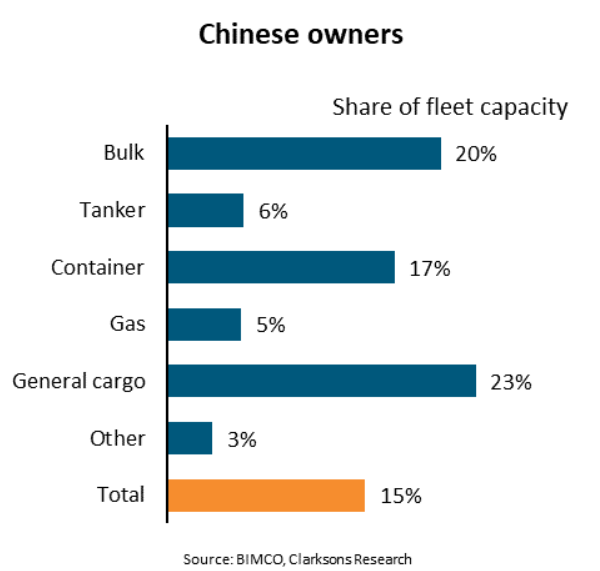
The focus of Chinese shipowners has been slightly different. They control a smaller share of tankers and gas carriers but a higher share of the general cargo and container fleets, with COSCO Shipping contributing to the higher share of the container fleet.

The entry of Chinese financial institutions into the leasing market has significantly contributed to the growth of the Chinese owned fleet in recent years, and five out of the 10 largest Chinese shipowners are leasing institutions. Combined, the ten largest shipowners control 41% of the Chinese owned fleet.

The ten largest Greek shipowners are all “traditional” shipowners. Unlike the top ten Chinese owners, the top ten list of Greek shipowners is not dominated by one large owner. Instead, there are seven owners with fleets larger than 10 million deadweight tonnes whereas only three Chinese shipowners have such large fleets.

Even though the Chinese fleet has fewer large owners, the order book held by all Chinese shipowners is 21% larger than the order book held by Greek owners.

Although Greek owners are often very active in the second-hand market, this could indicate that the Chinese fleet may grow faster than the Greeks’ fleets in the coming years.

“Common to both Chinese and Greek shipowners is that relative to their existing fleet, their order books are for LNG carriers and Pure Car Carriers (PCC), two markets currently experiencing solid growth. Chinese owners hold the largest order books in these segments. The order book for LNG and PCC ships is respectively 126% and 260% of the current fleet,” says Rasmussen.

Source: Container News

READ MORE

ICTSI increases revenues and profits in 2023 9M

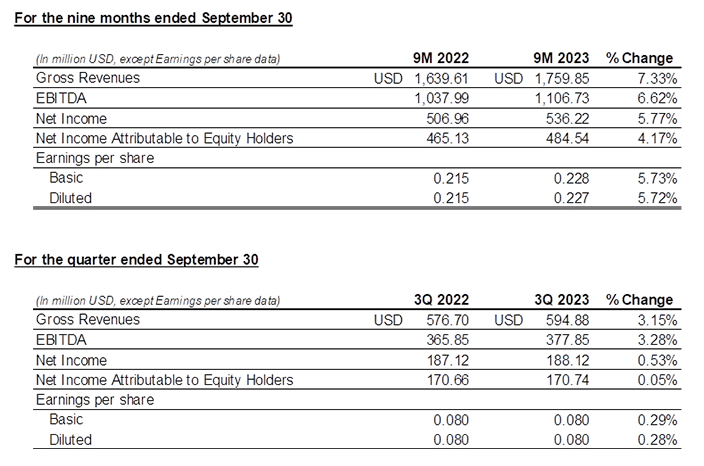
International Container Terminal Services, Inc. (ICTSI) reported unaudited consolidated financial results for the nine months of 2023 posting revenue from port operations of US$1.76 billion, an increase of 7% compared with the same period in 2022.

ICTSI reported Earnings Before Interest, Taxes, Depreciation and Amortisation (EBITDA) of US$1.11 billion, 7% higher than the US$1.04 billion generated in the same period last year and net income attributable to equity holders of US$484.54 million, 4% more than the US$465.13 million earned in the first nine months of 2022

ICTSI said the figures are driven by higher operating income and interest income, and lower Covid-19-related expenses; partially tapered by nonrecurring impairment of goodwill attributed to Pakistan International Container Terminal (PICT) in the previous quarter and increases in depreciation and amortization, interest on loans, lease liabilities and concession rights payable.

In the same period, ICTSI handled 9,451,912 TEUs, translating to a 7% year-over-year growth with the contribution of Manila North Harbour Port playing an important role.

Additionally, ICTSI’s gross revenues from port operations for the first nine months of 2023 increased by 7% to US$1.76 billion mainly due to the contribution of MNHPI and new businesses at IRB Logistica in Brazil, tariff adjustments, volume growth and higher revenues from ancillary services and general cargo business at certain terminals.

Source: Container News

READ MORE

Supply constraints continue in more pockets, but how low is the demand?

The addition of St. Lawrence’s Seaway to the map of disruptions has added yet another key pocket of constraints. The Panama Dilemma has been continuing with fewer vessels approved to pass through the locks, despite a priority for container vessels.

The ongoing strikes in the St. Lawrence Seaway, may not impose a long drag until mid-2024 as the Panama situation might.

Talks have apparently resumed and are ongoing to cull the impact. While the Suez thankfully is not, there is an upcoming transit fee rise starting the 15th of January 2024. Cancellations of key service sailings are at 7%, a little less when compared to the same time last year, but still considerably high.

And yet all this has not triggered a support or a cushion for the sinking spot container rates. A four-year Low is what the Drewry Composite aka the Drewry World Container Index (WCI) reported on the 26th of October, 2023 by quoting US$1,342. At around the 31st of October, 2023, the index would have hit a four-year low technically. Have the demand indicators been so weak, yet? We have officially entered into the holiday season, with the Chinese New Year stretch that took place in the first week.

The next year is all set to be the Year of the Dragon, a year that is supposed to bring in good fortune, luck, etc. But how pragmatic have the indicators been, so far? The Chinese factory activity has been sinking on one hand, as reported for the fifth straight time, while geopolitical tensions have been rising on the other.

A look at the rates from the Drewry perspective, for instance, sees most rates at multi-year lows. Transatlantic rates have been at the bottom end for a while. The China-Europe rates are at a stone’s throw away from rushing below the four-digit mark, currently at US$1,004. Similar rates reported by others such as Xeneta and Freightos, depict the quotes lower (US$960- US$978).

The China-Mediterranean rates too report a four-year low. What’s a little unreal is the kind of quotes in the backhaul trade. North Europe to China (courtesy: Xeneta) seems to trade at US$200 while the rate is even lower for the Mediterranean-China backhaul at US$155 (Courtesy: Freightos).

Considering the kind of Operating expenditures, this could be a brunt for the downstream players. It was once reported that certain trade lanes, say from India to Malaysia and South East Asia, clocked negative rates too.

The operators too seem to want to cushion this. While the Alliance has been shutting trade loops, sailings and services, from an operator perspective we are seeing the hike in rates- for Freight All Kinds (FAK).

A series of Gross Rate Increases (GRI) from April to August did little to stem the decline, despite momentary arrests and it seems the actual cushion could come in, just around an economic reversal. How long would that be? The GDP outlook for the globe appears to be in similar lines with 2024, so maybe a fillip post the Summer of 2024?

The way this pans is that it has been affecting and could further affect other areas of freight. Loose bulk and mini-bulk cargo sections have been finding container vessels and this could continue keeping those rates at bay.

Air Freight, on the other hand, has been kept under check. The rates spiralled up in line with the container spot price peaks but have resorted to a lower composite figure owing to lesser supply chain disruptions and can perhaps see some cushion owing to the just-in-time inventory flows in line with the holiday season.

Source: Container News

READ MORE

17 Benefits Of Using Logistics Technology Solutions To Customers And Supply Chains

Whilst the growth of most industries has been underpinned by the rapid adoption of new technology, the shipping and logistics industry has been a notable exception in this regard.

Still adhering to processes and customs in vogue for decades, the shipping and logistics industry has been a laggard when it comes to implementing new technological solutions for automating workflows and digitising documentation.

This is, to a great extent, due to the global nature of the industry, spanning diverse jurisdictions and a multitude of stakeholders.

The sheer number of variations to the broad process of international transport poses considerable challenges in the industry wide adoption of technology.

However, with the increasing geographical diversification of international trade and the growing sophistication of supply chains, customers are now holding their transport vendors accountable to higher standards of performance.

In order to optimise their own dispersed supply chains and streamline inventory management, big manufacturers and importers require shipping carriers and global freight forwarders to provide functionalities such as real-time shipment visibility, daily status reports, automated pre-alerts and information sharing, and digitised processes.

These evolving market requirements can be met only by the implementation of the latest software solutions which are designed specifically to cater to the shipping and logistics industry.

Further impetus to the imperative for digital transformation was provided post-2020 by the Covid-induced lockdowns and mobility restrictions, which quickly spiralled into port congestion across the globe and supply chain disruptions on unprecedented magnitude.

During that time, remote working necessitated automation and digitisation workflows, compelling corporates and government authorities to move away from manual paperwork-based tasks.

Moreover, the delays were so severe that manufacturers and retailers could not plan their supply chain and transportation schedules with any semblance of reliability. They, therefore, realised the value of real-time visibility to determine when cargo would actually reach the intended destination, which in turn would facilitate the planning of production schedules and inventory replenishment.

These challenges made transport service vendors more open to the concept of using technology, with a greater number of logtech vendors foraying into the market to fulfil this need.

Consequently, we have, over the past few years, seen a proliferation in the number of logistics technology solutions available in the market, offering varying levels of functionalities.

The game-changer in this regard has been the advancements in Artificial Intelligence (AI) and Machine Learning (ML), which have enabled the development of sophisticated logistics technology solutions aimed at the holistic transport process or specific aspects thereof.

Benefits of logistics technology:

In this article, we will understand the benefits and advantages that accrue from the usage of technological solutions:

1. Reduction in manual effort:

With systems taking care of rote tasks, document processing and information sharing amongst various stakeholders, much manpower is saved. This manpower can be gainfully utilised for core business activities once the amount of paperwork and mundane tasks is reduced.

2. Higher accuracy:

When a process is handled manually, there always exists the risk of human errors, especially with repetitive tasks or complex procedures. When these activities are handled by systems, the probability of errors is negligible. This leads to higher accuracy levels and eliminates risks arising from errors of omission and commission.

3. Faster processing:

Since systems can process data faster than humans, another obvious benefit is the faster processing of data and completion of tasks. This leads to faster information sharing and minimises delays that could possibly arise from delayed submission of data to government departments and customs officials.

Customers also get earlier intimation about possible delays or contingencies or where certain specific actions (such as submitting some document or making corrections to paperwork submitted) are required.

4. Better compliance levels:

Technology helps ensure that all steps in the transport process are completed well in time, including document submissions and complying with applicable regulations. This negates the risks of penalties and delays in cases of non-adherence to procedures and regulations.

5. Cost savings:

The combination of faster data processing, greater accuracy levels and reduction in effort leads to considerable cost savings. Apart from the obvious savings from reduced manpower and time expended, savings also accrue from better planning and inventory management (which helps reduce overall transport costs and rationalising inventory holding costs).

6. Enhanced efficiency:

Due to better accuracy and access to high-quality data, companies can enhance their efficiency levels and boost the level of service offered to customers.

7. Higher data security levels:

With manual processes, there are always the risks of papers being lost or information being accessed by unauthorised persons. Technology can help overcome this aspect and boost data security, as the data is now stored in digital format (so no papers or hard copies lying around), access to which is generally restricted only to people authorised to access and view the data.

This aspect has recently gained considerable importance due to the increasing governmental focus on data security and the introduction of legislation obligating companies to take adequate care of data in their possession (with stiff monetary penalties and other strictures in case of failure to safeguard data security).

8. Timely alerts on various milestones in the shipping process:

With auto-generated pre-alerts, importers and exporters are made aware of actions that must be taken at each stage in the import process. This greatly helps importers to plan onward movement of goods or ensure compliance with regulations, as the case may be. Since the alerts are auto-generated by the system, there is no possibility of any notification not being shared.

9. Real-time visibility:

Customers are now aware of the advantages of real-time visibility of cargo location and status. Post-Covid, most customers now prefer relying on technology to be able to get real-time visibility on the status (and sometimes, condition) of their cargo.

This helps customers understand possible delays and other contingencies, for which they can prepare in advance or arrange timely evacuation and inland movement, even before the container has been discharged.

Visibility and status information can also help reduce detention and demurrage costs, as importers are aware of when the container will be discharged and can therefore make arrangements in advance for the immediate evacuation and de-stuffing of the container, well within the free time allowed by the carrier and port operator.

10. Better supply chain planning:

All the above factors significantly improve the quality of supply chain planning, making the transport process more efficient and streamlined. Customers can plan better, reduce inventory levels, and avoid risks arising from failure to comply with applicable rules and regulations. Improvements in supply chain planning also permit smoother multimodal transport movement, with arrangements being made well in advance.

11. Better analytics and forecasting:

While the data generated in export and international transport transactions is massive, because it is not digitised or stored in one location, it is difficult for businesses to analyse the data and draw meaningful inferences therefrom.

Also, the vastness of the data renders it beyond human capacity to process and analyse all the data. With logtech software, however, all the data is digitised and saved centrally. After using the system’s superior computing power, businesses can analyse the data at the most granular level possible and glean analytical insights. Functionalities like predictive analytics take this a step further by identifying past patterns and suggesting recommended courses of action for the future.

12. Pre-empting possible contingencies and enabling better contingency planning:

Systems can combine data from a wide range of sources, covering the entire gamut of factors that can affect the movement of goods. An example is analysing weather forecasts along a vessel’s route to understand the impact of inclement weather on sailing schedules and possible delays. This is then highlighted as a possible risk factor, along with the probable extent of delays. The software can also help identify alternate routings that would be more appropriate under the given circumstances.

Such analysis helps a business pre-empt possible contingencies and take apt remedial actions or at least make contingency plans (such as increasing inventory levels to counter the impact of delayed deliveries or sourcing from different locations).

13. Seamless integration and co-ordination with stakeholders:

Since information sharing is automated and pre-alerts are sent to relevant stakeholders by the system itself, all parties are in timely possession of information that is necessary for them to perform their duties. Besides, with pre-alerts to remind them of upcoming tasks, the possibility of delayed action is minimised. Since this process is automated, the dependence of departments on each other for the sharing of information is reduced, and tasks are completed timely, which leads to smoother coordination amongst internal and external stakeholders.

14. Lower operational costs:

While the capital expenditure involved in deploying a logistics software solution is high, the subsequent cost savings lead to a significant lowering of operational costs. Companies can reduce headcount and reallocate human resources to high-value tasks, resulting in higher productivity.

15. Improved customer experience

The streamlining of logistics processes and tasks helps improve the functioning of the supply chain in terms of faster completion of customer orders, ready availability of inventory to fulfil orders, lower probability of stockouts, shorter delivery times, and proactive communication in case of delays and contingencies. The net result is a superior customer experience.

16. Competitive edge

The deployment of technology helps improve internal efficiency and customer satisfaction levels, which translates into a distinct competitive edge vis a vis competitors who still rely on outdated manual working modes. This competitive edge further translates into commercial advantages in the form of attracting new customers and gaining more business from existing customers.

17. Sustainability and Green Operations:

Using technology can help a carrier or logistics service provider make their operations eco-friendly and more sustainable in the following ways:

a) Minimise the use of paper by digitising documents

b) Optimise route planning by selecting shorter routes

c) Reduce bunker consumption by selecting the best routing options (regarding distance, weather conditions, maximising cargo picked up on the same voyage, better stowage planning, etc.)

d) compare and evaluate different products/alternatives to understand carbon impact and select the more eco-friendly option

Way forward for technology in maritime and logistics

Over the past few years, certain market leaders, such as the A.P Moller Group (in shipping and ports) and Kuehne and Nagel (in logistics and global freight forwarding), have made concerted efforts and invested heavily in developing technological solutions to improve internal efficiency and smoothen external co-ordination, while even mid-sized and smaller players have incorporated technology, primarily in their internal operations or specific aspects thereof.

These initiatives have, however, been restricted to the individual company’s internal sphere of operations rather than being at the wider or industry level.

In recent years, considering the increasing complexity of international business compounding the difficulties posed by the multiple myriad factors that need to be taken into account to optimise transport planning, shippers and global freight forwarders have been compelled to leverage technology to make their businesses more efficient and effective and decision-making more scientific.

As more and more companies harness the potential of technology, other companies see a clear business case for investing in technology (aside from the fear of missing out and falling behind the competition should they not adopt technology at a sufficiently early stage).

Also, since most shipping companies and freight forwarders rode the post-covid transportation demand boom and capitalised on record high freight rates, they are presently in a robust financial position, allowing them the latitude to take the long-term view and with sufficient cash reserves to invest in quality technological solutions.

Besides, with customers becoming increasingly more demanding, technology can be a source of competitive advantage and help carriers differentiate themselves in what is devolving into a highly commoditised industry.

Logtech solution providers, too, have been on a quest to constantly improve their products by incorporating the latest advancements in Artificial Intelligence (AI) and Machine Learning (ML).

The intensely competitive nature of the logtech market has also had the effect of democratising the logtech industry, where even small and medium-sized players can find technological solutions that are appropriate for their scale and budgets.

Therefore, it is highly likely that technology will become more prevalent in the maritime and logistics industry in the foreseeable future. With the rapid progress made in the fields of AI and ML, technological solutions will gain sophistication, providing reliable and affordable solutions that will boost their adoption even more.

In the long run, these technological solutions will steadily upend the existing ways of working and usher in a new era of tech-enabled supply chain planning and operations.

Source: Marine Insight

READ MORE

China and Hong Kong – The largest demanding importers for Vietnamese pangasius

China and Hong Kong have maintained the top import markets of Vietnamese pangasius from 2019 until now and are the largest consuming markets of Vietnamese pangasius.

According to data from Vietnam Customs, in September 2023, Vietnam’s pangasius exports recorded the first positive growth since the beginning of this year, with a value of nearly 167 million USD, an increase of 1% year on year.

Cumulative exports of Vietnamese pangasius in the first 9 months of this year reached nearly 1.4 billion USD, down 31% over the same period last year. In particular, the main export product is still pangasius under code 0304 (except fish cakes and surimi products) reaching 1.1 billion USD in 9 months of this year, accounting for 82% of the proportion. In September 2023 alone, exports of this product to markets reached 135 million USD, down 4% year on year. This is also the lowest decrease recorded since the beginning of this year. Meanwhile, other export products also witnessed downtrends. In details, live, fresh, freeze-dried pangasius products (under code 03) (except fish under code 0304) reached 222 million USD, accounting for 16% of the proportion and other processed pangasius (under code 16) reached 22 million USD, accounting for 2% proportion.

Regarding consumption markets, in September 2023, Vietnamese pangasius exports to a number of main markets recorded positive double-digit growth such as China and Hong Kong, EU, Brazil, Mexico… In addition, other markets such as The US, CPTPP, Korea, and Singapore still recorded a decline of 3% – 54% compared to the same period last year.

In September 2023, China and Hong Kong imported 56 million USD of Vietnamese pangasius, an increase of 15% over the same period last year. By the end of September 2023, export turnover to China and Hong Kong reached 434 million USD, down 26% compared to the same period in 2022. China and Hong Kong continuously lead the top import and most demanding markets from 2019 until now.

As the second largest importer of Vietnamese pangasius, in September 2023 alone, the US bought nearly 23 million USD of Vietnamese pangasius, down 29% over the same period last year. High inventory in the US is the biggest factor declining the import demands of this country since the beginning of this year. Cumulative exports to this powerhouse in the first 9 months of 2023 reached 207 million USD, down 54% compared to the same period in 2022.

As one of the markets recording positive growth in September 2023, the EU recorded the stable consumption for Vietnamese export pangasius. In September this year, the EU consumed more than 14 million USD of Vietnamese pangasius, up 11% over the same period last year, up 9% over the previous month.

Overall, in the first 9 months of 2023, the EU imported 129 million USD of pangasius, down 19% over the same period last year. With positive export value growing again in September 2023, the EU is gradually returning to the race to import pangasius from Vietnam.

In the CPTPP market, although exports still decreased, the decrease narrowed to 4% in September 2023 with the export value of 21 million USD to this market. This was also the lowest decrease of this market sector since the beginning of this year. Notably, some markets in the CPTPP bloc recorded growth from 10% – 70% such as Japan, Mexico, New Zealand…

In September 2023, pangasius exports to some main markets showed positive signs of recovery after a long period of decline due to socio- economic fluctuations such as low growth due to declining aggregate demand, high inflation, tighten monetary policy, prolonged military conflict between Russia and Ukraine, geopolitical instability, food security, natural disasters, climate change…

According to the Vietnam Association of Seafood Exporters and Producers, among the main markets importing Vietnam’s pangasius, the Chinese market is still the biggest hope for Vietnamese seafood exporters. Since the reopened policy and the bounce back of trade activities, the China’s economy is hoped to revive in the end year months. Therefore, demand for seafood consumption of this country will be stimulated considerably.

Pangasius export businesses expect that signs of recovery in the last month of the third quarter of 2023 will push the growth of Vietnam’s pangasius exports in the last quarter of this year.

Source: Customs News

READ MORE

Typical Q4 spike in box volumes yet to be seen in Oakland

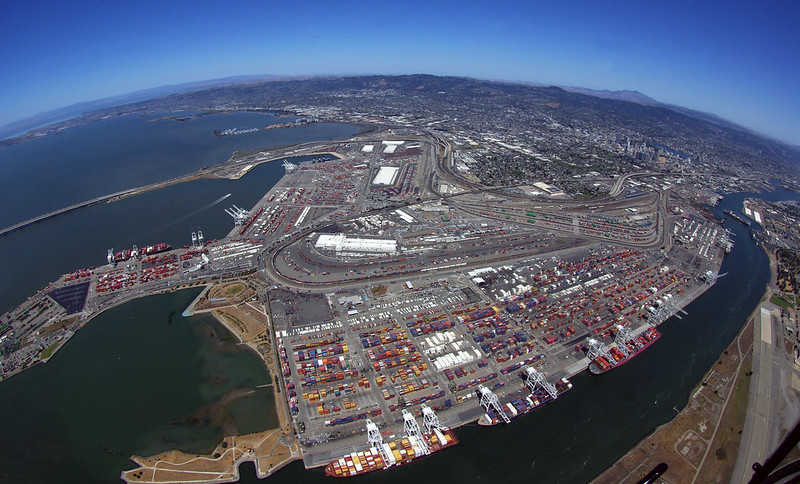
The port of Oakland’s September container volume remained relatively steady compared with August box throughput reaching 134,186 TEUs, marking a slight 1.2% increase over the same month in 2022.

September’s full exports jumped 9.1% year-on-year to 59,757 TEUs, but full imports inched down 4.3% to 74,428 TEUs. For the same month, Oakland’s empty imports dropped by 22.8% year-on-year to 11,208 TEUs and empty exports shrank by 29.8% to 26,429 TEUs.

“Shipping volumes have declined globally,” said the Californian port in a statement. “In response, shipping rates have declined to very low levels and ocean carriers have begun to alter their schedules, canceling some trans-Pacific vessel sailings.”

However, vessel calls at the port of Oakland continue to increase in 2023, with 744 calls, rising 17% over 2022.

“The Port of Oakland’s current container volume is consistent with the leveling off of global container traffic,” pointed out maritime director of Port of Oakland, Bryan Brandes, who went on to add that  “vessel calls to the Port have increased this year, pointing to a slow and steady recovery from the turmoil of the past couple of years.”

Although container volumes typically spike in the fourth quarter in preparation for the holiday season, the port of Oakland said it has not seen a noticeable increase yet.

“This may be attributable to a combination of high inventory levels, retailers ordering more goods from factories in Mexico and Canada rather than Asia, and/or consumer demand slowing in the Port of Oakland’s main market–Northern California,” explains the US port.

Source: Container News

READ MORE


Recent Comments by lambui

    No comments by lambui